Employee Productivity Ratio: Formula & Calculation Tips
Learn how to calculate employee productivity ratio using formulas, examples, benchmarks, and practical tips to improve team performance across departments.

Your team stays busy throughout the day, completes tasks, attends meetings, and maintains regular attendance, yet the overall output still feels lower than expected, which makes it difficult to understand whether employee effort is truly contributing to meaningful business results. The employee productivity ratio closes this gap by connecting employee input directly to measurable output, giving a clearer picture of real workforce performance.
In this guide, you’ll learn how to calculate the employee productivity ratio using simple formulas and practical examples across different teams. You’ll also understand what affects productivity ratios, what a good ratio actually looks like, and the common mistakes that can lead to misleading productivity insights.
What Is the Employee Productivity Ratio?
The employee productivity ratio is a performance measurement used to evaluate how efficiently employees convert time, effort, or resources into measurable business output. Companies calculate this ratio by comparing total output, such as completed tasks, sales, revenue, projects, or units produced, against total input, including hours worked, labor cost, or workforce size.
A higher productivity ratio generally indicates that employees are generating more value with the resources available, helping businesses identify performance trends, operational efficiency, and areas that need improvement.
How Do You Calculate the Employee Productivity Ratio?
You can calculate the employee productivity ratio by comparing the total output employees produce with the total input used to generate that final output. The calculation helps you understand how efficiently your team converts time, effort, or labor into measurable business results.
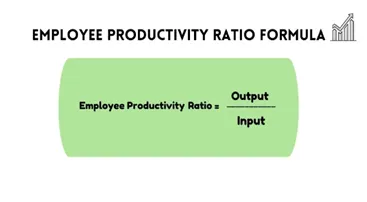
Employee Productivity Ratio Formula:
- Output can include completed tasks, sales, projects, tickets resolved, or units produced.
- Input usually includes hours worked, labor costs, or the number of employees involved.
Step 1: Define the Output You Want to Measure
Start by identifying what productivity means for your team or department. Sales teams may track revenue generated, support teams may measure resolved tickets, and production teams may count units produced. Choose an output that clearly reflects completed work.
Step 2: Measure the Total Input
Next, calculate the total resources used to produce that output. Use total work hours, labor cost, or employee count as the input measurement. Keep the input consistent to make your future comparisons accurate.
Step 3: Apply the Productivity Ratio Formula
Divide the total output by the total input to calculate the ratio. The result shows how much output employees generate for every unit of input used during a specific period.
Employee Productivity Ratio = Total Input/Total Output
For example, if a support team resolves 600 tickets in 300 work hours, the productivity ratio would be:
600/300 = 2
This means the team resolves an average of 2 tickets per work hour.
Step 4: Analyze the Results in Context
Review the ratio together with workload complexity, work quality, and operational conditions to understand the complete productivity picture. Compare the results consistently over time to identify meaningful productivity trends and performance changes.
Step 5: Track the Ratio Consistently
Calculate productivity ratios regularly using the same formula and measurement period. Monthly or quarterly tracking helps you identify workflow inefficiencies, operational improvements, and long-term performance changes more accurately.
Not sure if your team is truly productive?
Track real work and productivity trends clearly with Time Champ.
What Is Considered a Good Employee Productivity Ratio?
There is no single benchmark that defines a “good” employee productivity ratio. The right ratio depends on the type of work, team structure, project complexity, workload, and industry standards. A ratio that looks excellent for one team may be average for another team handling different responsibilities.
Create your own productivity baseline by tracking the ratio consistently over a month or quarter. The most valuable insight comes from tracking how the ratio changes consistently over time.
A few honest principles for benchmarking:
- Compare against yourself first. Last quarter's ratio for the same team is usually the most useful benchmark.
- Be careful with cross-team comparisons. Teams with different responsibilities rarely produce comparable productivity ratios.
- Avoid relying heavily on public industry benchmarks. Most businesses operate with different workflows, workloads, and team structures.

Did you Know?
According to the Microsoft Work Trend Index 2025, knowledge workers now spend nearly half of their workday in meetings and chats, leaving less uninterrupted time for focused work. As meeting loads increase, productivity ratios may decline even when employees maintain the same level of effort.
How Do You Improve Your Employee Productivity Ratio?
Improving the employee productivity ratio is usually about removing unnecessary work, delays, and inefficiencies that reduce output. Small operational improvements can create better long-term productivity results than simply increasing workloads.
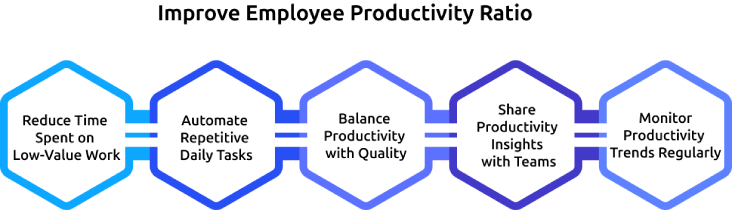
Reduce Time Spent on Low-Value Work
Identify unnecessary meetings, repetitive updates, and manual tasks that consume productive hours. Remove or simplify these activities to free up more time for focused work. Small reductions in daily distractions can significantly improve overall team productivity over time.
Automate Repetitive Daily Tasks
Look for recurring tasks like manual reporting, approval follow-ups, or status tracking. Use automation tools to reduce repetitive tasks and improve daily efficiency. Automation also helps employees spend more time on high-value and strategic work.
Balance Productivity with Quality
Track work quality alongside productivity metrics to ensure faster work does not create errors, rework, or customer issues. Consistent quality leads to sustainable productivity improvements. Maintaining quality standards also helps your team avoid long-term operational and customer-related problems.
Share Productivity Insights with Teams
Make productivity data visible so employees can spot where time slips away. Encourage teams to suggest workflow improvements and identify operational bottlenecks. Employees recognize inefficiencies faster because they work closest to day-to-day processes.
Monitor Productivity Trends Regularly
Track the employee productivity ratio consistently using weekly or monthly averages. Long-term trends deliver more reliable insights than judging performance from short-term fluctuations. Regular monitoring also helps you identify workflow issues before they affect overall productivity.
Challenges of Measuring Employee Productivity Ratio
The employee productivity ratio helps you measure workforce performance, but it does not always capture the complete context behind productivity data. Several operational and performance factors can affect the accuracy of productivity measurement if you evaluate the ratio without deeper analysis.
Work Quality
A team may complete more work in less time while producing errors, rework, or customer complaints. Focusing only on output can create misleading productivity insights. Track quality metrics like customer satisfaction, accuracy rates, or rework percentages along with productivity data.
Work Complexity
Different tasks require different levels of effort, skill, and time. Teams handling more complex projects may appear less productive even when they perform efficiently. Group similar tasks together or use complexity-based benchmarks for more accurate productivity evaluation.
Cross-Team Dependencies
One team’s productivity often depends on support from other departments. Delays in approvals, technical fixes, or communication can reduce productivity even when employees work efficiently. Identify workflow bottlenecks across departments and improve collaboration between dependent teams.
Individual Employee Performance
Productivity ratios work better for measuring team performance than evaluating individuals. External factors, workload distribution, and operational delays can affect personal productivity results. Use productivity data to improve processes and workflows without relying on it as the only employee performance indicator.
How Does Time Champ Help You Calculate and Improve Productivity Ratios?
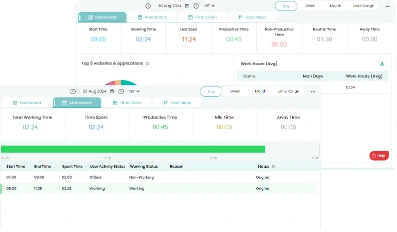
You may track work hours, tasks, and performance data across multiple tools, making productivity measurement inconsistent and difficult to manage. As a result, you may struggle to identify whether employees are generating meaningful output or simply staying active throughout the workday. Time Champ is an employee monitoring software with built-in workforce intelligence that help you track work patterns, measure output, and calculate the employee productivity ratio with greater accuracy and consistency.
With productivity tracking features like active and idle time monitoring, focus hours, application usage, project tracking, and task time analysis, Time Champ shows exactly how work gets done across teams and roles. The platform automatically converts these insights into easy-to-understand productivity reports, helping you identify workflow gaps, monitor performance trends, and improve operational efficiency without relying on manual calculations or inconsistent tracking methods.
Finding it difficult to measure productivity accurately across teams and projects?
Time Champ gives you accurate productivity tracking and performance insights.
Conclusion
Measuring productivity without clear data often leads to assumptions, inconsistent evaluations, and missed performance opportunities. The employee productivity ratio helps you connect employee effort with actual business output, making it easier to identify workflow gaps, improve efficiency, and support better decision-making across teams. However, the ratio becomes truly valuable only when you track it consistently, compare trends over time, and balance productivity with work quality. Small improvements in workflows, time management, and operational efficiency can create significant long-term results. With the right productivity tracking approach and workforce insights, businesses can move beyond activity-based reporting and build a more focused, efficient, and high-performing workplace.

Anjali
Table of Content
 What Is the Employee Productivity Ratio?
- How Do You Calculate the Employee Productivity Ratio?
- What Is Considered a Good Employee Productivity Ratio?
- How Do You Improve Your Employee Productivity Ratio?
- Challenges of Measuring Employee Productivity Ratio
- How Does Time Champ Help You Calculate and Improve Productivity Ratios?
- Conclusion
Related Blogs

Learn how to analyze productivity data, identify patterns, avoid common mistakes, and build reports that turn insights into clear, actionable decisions.
Thasleem Shaik | May 01, 2026Learn the difference between productivity tracking and time tracking, how they work, and which approach helps improve team performance and visibility.
Guna Lakshmi | May 09, 2026
Explore the most important productivity metrics and KPIs to measure employee performance, improve efficiency, and boost workplace productivity.
Anjali | May 12, 2026
Learn what workforce productivity is, key factors, metrics, and ways to measure and optimize it. Discover AI’s role in improving workforce efficiency.
Chethana Choudary | October 01, 2025
Learn how to track productivity in the workplace using proven methods, role-based metrics, and tools. A practical 2026 guide for modern managers and teams.
Jahnavi Pulluri | May 06, 2026Explore the top benefits of productivity tracking software for better visibility, balanced workloads, smarter planning, and improved business decisions.
Guna Lakshmi | Apr 30, 2026Ready to Manage Your Workforce Smarter?
Join our family of 1500+ companies using smart insights to redefine workforces!
Free Trial
No Credit Card Required