How to Calculate and Improve Agent Productivity in Call Centers
See how to calculate agent productivity in a call center using practical formulas, examples, key metrics, and proven ways to improve agent efficiency.
In a call center, productivity is not just about how many calls an agent answers in a day. It is about how well each conversation is handled, how quickly issues are resolved, and how smoothly the team uses its time. When you measure productivity the right way, you see more than numbers on a dashboard. You see where agents are doing well and where they need support.
In this guide, we’ll look at simple ways to calculate agent productivity and improve it in a practical, people-focused way.
What Is Agent Productivity in a Call Center?
Agent productivity in a call center means how effectively agents use their working time to handle customer interactions and complete support tasks. It looks at the balance between speed, quality, availability, and outcomes, not just the number of calls answered.
A productive agent resolves issues efficiently, keeps conversations focused, follows the right process, and helps customers move forward without unnecessary delays.
How to Calculate Agent Productivity: Formulas and Examples
To calculate call center agent productivity, you need more than one number. The number of calls handled, time spent, resolution rate, and customer outcomes each give you a different view of agent productivity.
Start by tracking the core productivity metrics below. The formulas give you a simple way to calculate each metric and compare your results over time.
| Productivity Metric | Formula | What It Shows | Example | Typical Benchmark or Target |
|---|---|---|---|---|
| Average Handle Time (AHT) | (Talk Time + Hold Time + After-Call Work) ÷ Total Calls | How long you spend handling each call | 4 minutes talk time + 1 minute hold time + 2 minutes after-call work = 7 minutes AHT | Varies by call type, track against your team’s historical average |
| Agent Utilization | (Total Handle Time ÷ Total Logged-In Time) × 100 | How much of your logged-in time goes toward customer work | 6 hours of handle time ÷ 8 logged-in hours × 100 = 75% | Often targeted around 70% -85%, depending on workload and call complexity |
| First Call Resolution (FCR) | (Calls Resolved on First Contact ÷ Total Calls) × 100 | How often you resolve an issue without a repeat contact | 85 resolved calls ÷ 100 total calls × 100 = 85% | Many teams aim for approximately 70% - 85%, depending on the support model |
| Calls Per Agent Per Day | Total Calls Handled ÷ Number of Working Agents | Average daily workload per agent | 500 calls ÷ 10 agents = 50 calls per agent | Set a target based on call complexity, shift length, and service expectations |
| Occupancy Rate | (Call Time + After-Call Work) ÷ Total Available Time × 100 | How much of your available time you spend on customer work | 5.5 hours of customer work ÷ 7 available hours × 100 = 78.6% | Often monitored around 75% - 85% to balance productivity and workload pressure |
| Average Speed of Answer (ASA) | Total Wait Time ÷ Total Answered Calls | How quickly customers reach an agent | 1,000 seconds of wait time ÷ 200 answered calls = 5 seconds | Set according to your service-level goal, lower wait times generally improve access |
| Service Level | (Calls Answered Within Target Time ÷ Total Answered Calls) × 100 | How consistently you meet your response-time target | 180 calls answered within the target ÷ 200 answered calls × 100 = 90% | A common target is 80% of calls answered within 20 seconds, but targets vary |
| Call Abandonment Rate | (Abandoned Calls ÷ Total Inbound Calls) × 100 | How often customers leave before reaching an agent | 25 abandoned calls ÷ 500 inbound calls × 100 = 5% | Many teams aim to keep abandonment below 5%, depending on queue conditions |
| Customer Satisfaction (CSAT) | (Positive Survey Responses ÷ Total Survey Responses) × 100 | How customers rate their support experience | 120 positive responses ÷ 150 total responses × 100 = 80% | A CSAT score of 80% or higher is often considered a strong result |
| Cost Per Call | Total Operating Cost ÷ Total Calls Handled | The average cost of handling each call | $25,000 operating cost ÷ 5,000 calls = $5 per call | Compare against your historical cost and budget rather than using one universal target |
These calculations give you a practical starting point for measuring call center performance. The right combination depends on your goals, call complexity, service model, and the outcomes you want to improve.
The key is to avoid judging productivity from one metric. AHT can show speed, utilization can show how you spend your time, FCR can show resolution, and CSAT can show the customer outcome. When you bring these measures together, you get a much clearer view of call center agent productivity and where you can improve it.
Struggling to see where your call center productivity is falling short?
Use Time Champ to uncover productivity gaps and improve how your team uses time.
What are the Causes of Low Agent Productivity in a Call Center?
Low call center agent productivity can have several causes. Slow systems, unclear processes, heavy workloads, and too much manual work can make each interaction take longer. Here are some of the most common causes to look at.
1. High Occupancy with No Recovery Time
When agent occupancy gets too close to 100%, agents move from one call to the next without any time to rest. This may look efficient, but it can quickly exhaust your team. Handle times may increase, mistakes may become more common, and quality scores may drop. Keep agent utilization rates at a healthy level instead of trying to keep agents busy all the time. Tired agents usually produce less, not more.
2. Gaps in Training and Product Knowledge
If your agents keep placing customers on hold to search for answers, the issue isn't effort, it's knowledge. Weak onboarding and outdated training material force agents to guess or dig through disconnected systems mid-call. This directly increases average handle time and drags down first call resolution, both of which pull your call center productivity metrics down together.
3. Outdated or Fragmented Tools
Agents who use five different screens for one customer interaction lose time on every call. Outdated CRMs, slow ticketing systems, and disconnected tools force agents to do manual tasks that software should handle. This is one of the most common and easiest causes of call center employee productivity decline to fix.
4. Poor Scheduling and Forecasting
Understaffing during peak hours can leave your agents overwhelmed, with little time to recover between calls. Overstaffing creates the opposite problem, leaving agents idle and increasing paid hours without enough work to fill them. Both issues often come from inaccurate call center forecasting that does not match actual call volume.
5. High Attrition and Constant Onboarding
Every time an experienced agent leaves, you lose their speed, product knowledge, and familiarity with your systems. New hires may need weeks or months to reach the same productivity level. This is why high BPO attrition often leads to lower team productivity, even when your processes and training materials are well documented.

Did You Know?
According to PwC, 55% of consumers said they would stop buying from a company after several bad experiences, while 32% said they would leave because of inconsistent experiences. These figures highlight how consistently positive customer experiences are essential for building trust, loyalty, and long-term relationships.
How to Improve Agent Productivity in a Call Center
Once you know where productivity drops, you can make focused changes instead of adding more pressure. Here are the areas that can make the biggest difference.
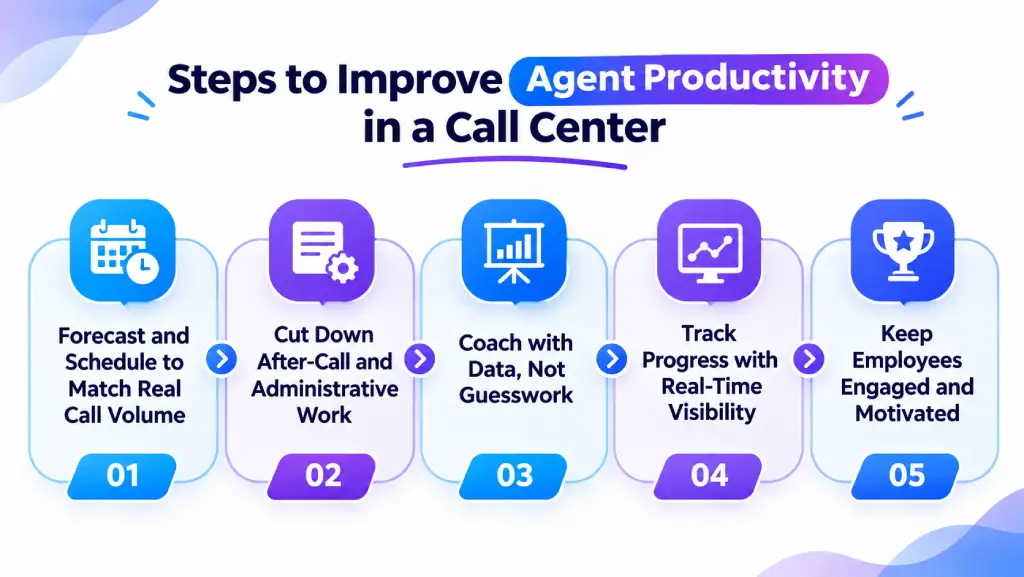
1. Forecast and Schedule to Match Real Call Volume
Get your staffing numbers right before making other changes. Review your past call volume by hour and day, then create schedules based on that data instead of using the same staffing level all day. This helps prevent understaffing during busy periods and idle time during slower periods. It is also a key part of any real call center agent performance improvement plan.
2. Cut Down After-Call and Administrative Work
Look at how much time your agents spend on notes, tagging, and status updates after each call. Use tools to automate repeated tasks, such as filling in ticket fields and creating call summaries. Keep manual data entry to a minimum. Every minute you save on after-call work gives your agents more time to help customers.
3. Coach with Data, Not Guesswork
Do not wait for a monthly review to coach your team. Use performance data to provide short, focused feedback based on each agent’s needs. For example, if an agent takes longer than usual on billing calls, review that process and coach the specific skill involved. Regular coaching helps correct small issues before they affect your call center productivity metrics.
4. Track Progress with Real-Time Visibility
You cannot fix a problem if you do not see it when it happens. Use call center real-time management dashboards to spot changes in occupancy or handle time right away. This lets you take action immediately instead of waiting for next week’s report. Real-time data helps you make better decisions and adjust your improvement plan as needed.
5. Keep Employees Engaged and Motivated
Employee engagement grows when frontline agents feel supported, included, and connected to their team. Encourage teamwork and peer learning by asking high-performing agents to share their routines, tips, and approaches with others. Involve agents in performance discussions and give them time to reflect on their own work instead of comparing individual KPIs, which can reduce motivation and trust.
How Time Champ Helps Measure and Improve Agent Productivity
Productivity can be difficult to improve when you cannot clearly see where your team's time goes. Long idle periods, frequent app switching, repetitive work, and uneven activity can stay hidden when you rely only on call volume or manual reports. Time Champ helps you turn this activity data into a clearer view of how your team uses working time, so you can spot gaps, understand work patterns, and make better productivity decisions.
Here are the key ways you can use Time Champ to understand and improve agent productivity.
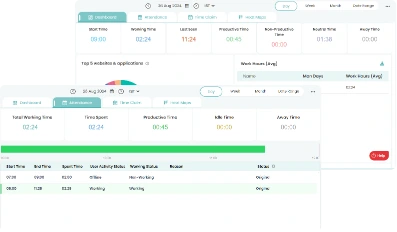
- Track Productive Time: See how working hours are divided into productive, non-productive, neutral, and away time. Comparing these patterns across days or periods helps you spot changes in productivity and understand where your team may need support.
- Identify Idle Time: Spot periods when activity drops during working hours. Looking at idle patterns can help you find scheduling gaps, workflow issues, or periods that need closer attention.
- Analyze App and Website Usage: See which applications and websites your agents use during work hours and how much time they spend on each. This helps you identify the tools they rely on most and understand whether their digital activity aligns with their daily responsibilities.
- Measure Activity Levels: Review activity patterns across the workday to understand when your team stays engaged and when productivity dips. This gives you more context than a single productivity percentage.
- Track Working Hours Automatically: Capture work hours and attendance without depending entirely on manual timesheets. This gives you a more consistent source of time data when you calculate and compare productivity.
Are productivity gaps hiding behind your call center numbers?
Try Time Champ for clearer visibility into time, activity, and productivity patterns.
Conclusion
When you understand how to calculate agent productivity in call center operations, you can make productivity easier to measure and improve. Look beyond call volume and focus on how efficiently your team uses time, completes work, and delivers good customer outcomes.
For teams that want clearer visibility into daily activity, Time Champ helps track productive time, idle time, working hours, and application usage. These insights can show you where productivity can improve. Ready to improve your call center productivity? Start your free trial of Time Champ today and get clearer visibility into your team’s daily performance.

Thasleem Shaik

Table of Content
 What Is Agent Productivity in a Call Center?
- How to Calculate Agent Productivity: Formulas and Examples
- What are the Causes of Low Agent Productivity in a Call Center?
- How to Improve Agent Productivity in a Call Center
- How Time Champ Helps Measure and Improve Agent Productivity
- Conclusion
Related Blogs
BPO capacity planning helps you avoid overstaffing and capacity gaps. See the formula, planning process, strategies, and ways to improve resource use.
Thasleem Shaik | Oct 23, 2026
Shrinkage in BPO can hurt staffing and service levels. See the formula, calculation, key causes, and practical ways to control shrinkage more effectively.
Anjali | Oct 14, 2026
Learn BPO benchmarking with 12 benchmarks, 2026 industry standards, a 7-step process, and mistakes that skew comparisons for better business decisions.
Jahnavi Pulluri | Oct 07, 2026
Track the most important BPO KPIs to measure agent performance, productivity, customer satisfaction, and overall contact center success in 2026.
Guna Lakshmi | Oct 02, 2026
BPO workforce management guide: the six-stage cycle, shrinkage and adherence formulas, real benchmarks, and 8 best practices that protect service levels.
Shabana Shaik | Sep 11, 2026
HIPAA compliance in BPO requires more than a signed BAA. See the rules, safeguards, PHI controls, breach duties, checklist, and key risks to address.
Thasleem Shaik | Oct 30, 2026


 4.7/5 avg.
Ready to Manage Your Workforce Smarter?
Join our family of 1500+ companies using smart insights to redefine workforces!

Free Trial
No Credit Card Required