Call Center Forecasting: Methods, Steps, and Best Practices
Learn how call center forecasting helps predict demand, plan staffing, and improve efficiency with practical methods, steps, and best practices.
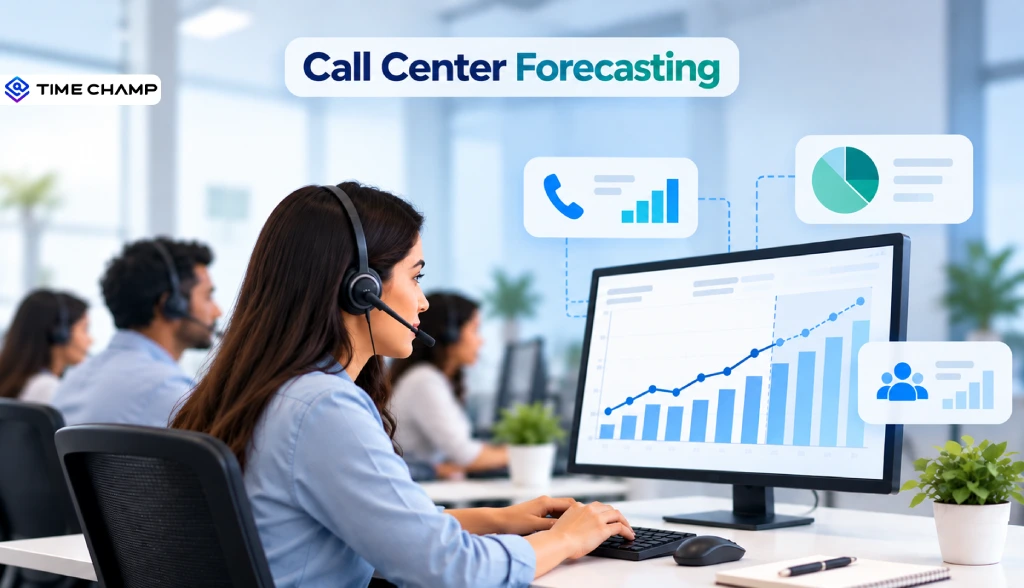
Running a call center without accurate forecasting can lead to understaffing during peak hours and overstaffing during slow periods. Call center forecasting helps you predict contact volumes, understand staffing needs, and schedule the right number of agents at the right time.
To make forecasting easier, we’ve included practical methods, step-by-step guidance, and proven best practices to help you turn your call data into more accurate forecasts and smarter staffing decisions.
What Is Call Center Forecasting?
Call center forecasting is the process of using historical data, customer demand patterns, and other factors to predict future call volumes and staffing needs. It helps you determine how many customer interactions to expect and how many agents you need at different times to maintain efficient operations and service levels.
Accurate forecasting also helps you respond to changing customer behavior. Instead of relying on guesswork, you can use data to make informed decisions about staffing, scheduling, workload management, and service levels. This makes forecasting an important part of effective call center workforce planning.

Did You Know?
Gartner projects that customer service interaction volume will increase by 16% between 2024 and 2028, making accurate demand forecasting increasingly important for contact centers.
Why Call Center Forecasting Matters
Accurate forecasting helps you make smarter workforce decisions and keep your call center prepared for changing demand. Here are the main reasons why call center forecasting matters:
- Plan Staffing Needs: Determine how many agents you need during different periods.
- Reduce Customer Wait Times: Ensure enough agents are available during peak hours.
- Balance Agent Workloads: Prevent agents from becoming overwhelmed during busy periods.
- Control Staffing Costs: Avoid unnecessary overstaffing during slower periods.
- Improve Service Levels: Maintain consistent performance and meet service-level targets.
- Prepare for Demand Changes: Anticipate seasonal trends, promotions, and unexpected volume increases.
- Improve Scheduling: Create agent schedules that better match expected call volumes.
Improve Your Call Center Workforce Planning!
Get better visibility into staffing needs, agent workloads, and call volumes with Time Champ.
Call Center Forecasting Methods and Models
Different forecasting methods work better for different types of call center data. The right approach depends on your call volume patterns, available data, and how predictable your demand is. Here are the main methods, from simple approaches to more advanced techniques.
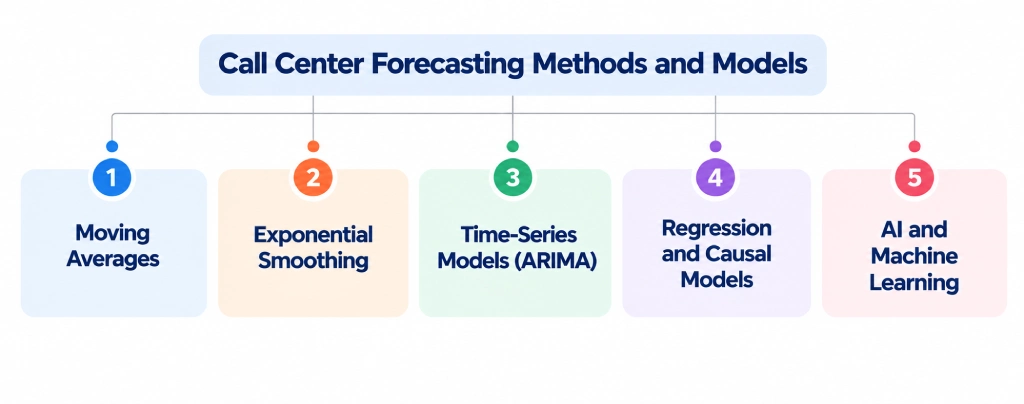
Moving Averages
Moving averages are one of the simplest ways to forecast future call volumes. By averaging data from recent periods, you can smooth out short-term fluctuations and get a clearer estimate of what to expect next.
Formula:
Forecast = (D₁ + D₂ + D₃ + ... + Dₙ) ÷ n
Where:
Forecast = Expected call volume for the next period
D₁, D₂, D₃ = Call volumes from previous periods
n = Number of periods included in the calculation
Example:
Suppose your call center received 900, 1,000, and 1,100 calls over the past three weeks.
(900 + 1,000 + 1,100) ÷ 3 = 1,000
Your forecast for the next week would be 1,000 calls.
Best for:
Call centers with relatively stable call volumes and limited forecasting requirements.
Exponential Smoothing
Exponential smoothing gives more importance to recent call volumes than older data. This makes it useful when recent changes in demand are more likely to influence your next forecast.
Formula:
Fₜ₊₁ = αAₜ + (1 − α)Fₜ
Where:
Fₜ₊₁ = Forecast for the next period
Aₜ = Actual call volume in the current period
Fₜ = Previous forecast
α = Smoothing factor between 0 and 1
Example:
Suppose your actual call volume is 1,200 calls, your previous forecast was 1,000 calls, and your smoothing factor is 0.3.
Fₜ₊₁ = (0.3 × 1,200) + (1 − 0.3) × 1,000
Fₜ₊₁ = 360 + 700
Fₜ₊₁ = 1,060
Your forecast for the next period would be 1,060 calls.
Best for:
Call centers with predictable trends or recurring seasonal patterns.
Time-Series Models (ARIMA)
ARIMA models are useful when your call volume follows more complex patterns that simple averages cannot capture. They analyze historical values and forecast future demand based on trends and relationships within the time series.
Formula:
ARIMA is commonly represented as:
ARIMA(p,d,q)
Where:
- p = Number of past values used to predict the current value
- d = Number of times the data is differenced to remove trends
- q = Number of past forecast errors used in the model
Example:
Suppose your call center has several years of historical data showing gradual growth, recurring fluctuations, and changes in demand. An ARIMA model can analyze these patterns to generate a forecast for future call volumes.
Best for:
Call centers with large amounts of historical data and more complex demand patterns.
Did You Know?
Gartner forecasts customer service spending to reach $47 billion by 2028, highlighting the growing investment in customer service operations and technology.
Regression and Causal Models
Regression models help you forecast call volume by connecting it to factors that influence customer demand. Instead of looking only at past calls, you can account for events such as marketing campaigns, holidays, billing cycles, or product launches.
Formula:
Y=a+bX
Where:
Y = Predicted call volume
a = Baseline call volume when the influencing factor is zero
b = How much the influencing factor affects call volume
X = Influencing factor
For multiple factors, you can use:
Y=a+b1X1+b2X2+⋯+bnXn
Example:
Suppose your call center normally receives 1,000 calls per day. Based on historical data, you know that a marketing campaign typically increases daily call volume by 20%.
Using the regression formula:
Y=a+bXY = a + bX
Assume:
a = 1,000 → Baseline daily call volume
b = 200 → Expected increase in calls from the campaign
X = 1 → The campaign is running
Now, calculate:
Y=1,000+(200×1)Y = 1,000 + (200 \times 1)
Y=1,200
Forecasted call volume = 1,200 calls per day
This means you can expect around 1,200 calls per day during the campaign, helping you plan enough agents to handle the additional demand.
Best for:
Call centers where known business events have a clear impact on customer demand.
AI and Machine Learning
AI and machine learning models can analyze large datasets and identify patterns that may be difficult to capture with traditional forecasting methods. They can combine multiple factors, such as call history, customer behavior, holidays, promotions, and other support channels, to generate more dynamic forecasts.
Formula:
AI and machine learning do not have one standard forecasting formula. The mathematical approach varies depending on the algorithm and model being used.
Example:
An AI model could analyze historical calls, chats, emails, holidays, and promotional campaigns together to predict how many customer interactions you may receive across each channel.
Best for:
Large or omnichannel contact centers with substantial historical data and highly variable demand.
Don’t Let Inaccurate Forecasts Cause Staffing Problems!
Use Time Champ to identify staffing gaps early and keep your call center prepared for changing demand.
How to Forecast Call Center Demand: Step by Step
A reliable call center forecast starts with clean historical data and ends with schedules that match actual customer demand. Follow these six steps to build a practical forecasting process.
Step 1: Collect and Clean Historical Data
Start by gathering 12 to 24 months of historical data, including call volume, average handle time (AHT), and call outcomes. Organize the data into consistent intervals, such as 15-, 30-, or 60-minute periods, so you can identify when demand changes throughout the day.
Before using the data, remove or flag unusual events such as system outages, major service disruptions, or one-time events that could distort your normal demand patterns. Remember, your forecast can only be as reliable as the data behind it.
Step 2: Identify Trends, Seasonality, and Intraday Patterns
Next, look for patterns that can help explain how your call volume changes over time. Identify long-term trends, weekly or monthly seasonality, holidays, and time-of-day peaks.
For example, you may find that call volumes are consistently higher on Mondays or increase after monthly billing dates. These patterns help you choose a forecasting method that fits your call center and create more accurate interval-level forecasts.
Step 3: Forecast Contact Volume and AHT
Once you understand your historical patterns, use your chosen forecasting method to estimate future contact volume for each interval. Forecast AHT separately because the number of calls alone does not determine how much agent capacity you need.
You should also account for known events that could change demand, such as promotional campaigns, product launches, holidays, or planned system changes. Combining your baseline forecast with these factors gives you a more realistic view of future workload.
Step 4: Calculate Staffing With Erlang C
After forecasting contact volume and AHT, calculate how many agents you need to handle the expected workload. Erlang C is a widely used workforce-management model that considers factors such as call volume, AHT, service-level targets, and waiting time to estimate the required number of agents.
For example, if your forecast shows a higher call volume during the 10–11 AM interval, Erlang C can help you determine how many agents should be available during that period to meet your target service level.
Keep in mind that Erlang C makes assumptions about the arrival and handling of calls, so the results work best when your operation broadly fits those assumptions.
Step 5: Adjust for Shrinkage
Your required staffing level is not the same as the number of agents you need to schedule. Shrinkage accounts for the time agents are unavailable for customer interactions because of breaks, meetings, training, leave, absenteeism, or other activities.
Use this basic calculation:
Formula:
Scheduled Agents = Required Agents ÷ (1 − Shrinkage)
Example:
If you need 40 agents and your shrinkage rate is 20%:
Scheduled Agents = 40 ÷ (1 − 0.20)
Scheduled Agents = 40 ÷ 0.80
Scheduled Agents = 50
So, you need to schedule 50 agents to have approximately 40 agents available to handle customer demand.
Step 6: Build Schedules and Manage Intraday
Finally, turn your staffing requirements into agent shifts and schedules that align with forecasted demand. Try to place more agent coverage during expected peaks and avoid unnecessary staffing during slower periods.
Forecasting doesn't stop once schedules are created. During the day, monitor actual contact volume, AHT, staffing levels, and agent adherence and compare them with your forecast. Feed these variances back into your forecasting process so your future forecasts become more accurate over time.
What Affects Forecasting Accuracy
Several factors can influence how closely your forecast matches actual call center demand. Paying attention to these areas can help you identify potential gaps and improve your forecasting process:
- Historical Data Quality: Incomplete, inaccurate, or inconsistent data can lead to unreliable forecasts.
- Data Volume and History: Limited historical data makes it harder to identify recurring trends and seasonal patterns.
- Seasonality: Holidays, weekends, billing cycles, and seasonal periods can cause predictable changes in call volume.
- Call Volume Trends: Sudden increases or decreases in demand can make historical patterns less reliable.
- Average Handle Time (AHT): Changes in how long agents spend handling interactions can affect staffing requirements.
- Unexpected Events: System outages, service disruptions, emergencies, or major news events can cause sudden demand spikes.
- Marketing and Business Activities: Promotions, product launches, price changes, and campaigns can increase or decrease contact volume.
- Customer Behavior: Changes in customer preferences, self-service adoption, or channel usage can shift demand patterns.
- Forecasting Method: A method that doesn't match your data patterns may produce less accurate results.
- Intraday Patterns: Differences in call volume by hour or interval can affect how accurately you plan staffing throughout the day.
- Agent Availability: Absenteeism, leave, training, meetings, and other shrinkage factors can affect how well your staffing forecast translates into actual coverage.
- Forecast Review and Adjustment: Regularly comparing forecasts with actual results helps you identify errors and improve future forecasts.
Ready to Improve Your Call Center Workforce Planning?
Use Time Champ to forecast demand, optimize staffing, and keep your agents aligned with customer needs.
Conclusion
Effective call center forecasting helps you move from reactive staffing to proactive workforce planning. Using clean historical data, the right forecasting method, accurate staffing calculations, and regular performance reviews can help you prepare for changing customer demand.
Review your forecasts against actual results, adjust your staffing plans, and continuously refine your approach to improve accuracy, control costs, and maintain consistent service levels.

Guna Lakshmi

Table of Content
 What Is Call Center Forecasting?
- Why Call Center Forecasting Matters
- Call Center Forecasting Methods and Models
- How to Forecast Call Center Demand: Step by Step
- What Affects Forecasting Accuracy
- Conclusion
Related Blogs

Understand what vanity metrics are, why they matter, examples, and how they differ from actionable metrics for measuring real business performance.
Guna Lakshmi | Oct 05, 2026
Learn how to calculate cost per contact in a call center, discover a good average benchmark, and understand the four key drivers that impact your costs.
Jahnavi Pulluri | Oct 06, 2026
Learn what the call center occupancy rate is, the formula, how to calculate it, what a good occupancy rate is, and how it differs from utilization.
Guna Lakshmi | Oct 13, 2026
Track the most important BPO KPIs to measure agent performance, productivity, customer satisfaction, and overall contact center success in 2026.
Guna Lakshmi | Oct 02, 2026
Learn what schedule adherence means in a call center, why it impacts service levels, how to calculate it, what a good rate is, and how to improve it easily.
Jahnavi Pulluri | Oct 08, 2026
Contact center services help businesses manage customer support across multiple channels. Compare types, benefits, costs, technologies, and AI trends.
Thasleem Shaik | Aug 10, 2026


 4.7/5 avg.
Ready to Manage Your Workforce Smarter?
Join our family of 1500+ companies using smart insights to redefine workforces!

Free Trial
No Credit Card Required