Vanity Metrics: Examples, Risks, and Right Metrics to Track
Understand what vanity metrics are, why they matter, examples, and how they differ from actionable metrics for measuring real business performance.

A high website traffic count, growing follower base, or rising number of video views may seem like strong results. But what if they do not lead to more customers, revenue, or retention? That is the concern with vanity metrics. They show activity and visibility but may not reveal whether your efforts are producing meaningful results.
To help you transform vanity metrics into measurable growth, we’ve covered common examples, how to identify them, and how to shift your focus toward actionable metrics.
What Are Vanity Metrics?
Vanity metrics are performance measures that may appear positive but provide limited insight into business performance or future decisions. They often measure visibility, reach, or activity without clearly showing how those results contribute to business objectives such as customer acquisition, revenue, or retention.
Vanity metrics can be useful for understanding audience reach and overall activity. However, they become less valuable when they are viewed without a clear connection to business objectives.

Did You Know?
Gartner found that only 22% of organizations have defined, tracked, and communicated business-impact metrics for most of their data and analytics use cases.
Vanity Metrics vs Actionable Metrics
Vanity metrics can show activity or visibility, while actionable metrics help you understand performance and decide what to do next. The difference is mainly in how closely the metric connects to your business goals and decision-making.
| 22% of organizations | https://www.gartner.com/en/newsroom/press-releases/2025-02-20-gartner-survey-finds-one-third-of-cdaos-cite-measuring-data-analytics-and-ai-impact-as-top-challenge | |
|---|---|---|
| What they show | Show attention, reach, or activity | Show actual business performance |
| Main focus | Visibility, audience size, and activity | Conversions, revenue, retention, and output |
| Business connection | May not clearly relate to business goals | Directly connected to business goals |
| Examples | Followers, page views, likes, impressions | Conversion rate, retention rate, revenue, customer acquisition cost |
| Value | Helps measure overall visibility and activity | Helps measure progress and guide action |
| Total page views | Shows how many times pages were viewed | Conversion rate by source shows which traffic sources generate results |
| Total registered users | Shows the number of people who signed up | Active users and retention rate show whether users remain engaged |
| Social media followers | Shows the size of your audience | Engagement rate and referral traffic show how the audience interacts and drives visits |
| Total downloads | Shows how many times an app or resource was downloaded | Activation rate and churn show whether users adopt and continue using it |
| Email open rate alone | Shows how many recipients opened an email | Click-through and reply rate show whether recipients took action |
| Hours logged / time at desk | Shows time spent working or at a desk | Productive time and output delivered show what was actually accomplished |
Common Examples of Vanity Metrics
Vanity metrics appear across marketing, product, sales, and other areas of a business. They are often easy to track and can provide a quick view of activity or reach. Here are some common examples grouped by function.
Marketing and Social Media
Marketing teams use these metrics to monitor audience reach, content visibility, and engagement across different channels.
- Page Views: The total number of times a webpage has been viewed. This metric is commonly used to measure website traffic and understand which pages attract the most visits.
- Impressions: The number of times content or an advertisement is displayed to users. It is widely used to measure the visibility of campaigns across search engines, websites, and social media platforms.
- Follower Count: The total number of people following a social media account. It provides a simple measure of how large a brand’s audience has become on a particular platform.
- Email Open Rate: The percentage of delivered emails that recipients open. Marketing teams commonly use it to assess initial interest in email campaigns and compare the performance of different subject lines.
Product and Growth
Product and growth teams track these metrics to understand how many people are joining, downloading, or interacting with a product.
- Total Registered Users: The total number of users who have created an account. It gives businesses an overall count of people who have registered for their product or service.
- Cumulative Downloads: The total number of times an app or digital product has been downloaded. This metric is often used to show the overall reach of an application or digital offering.
- Total Sign-Ups: The total number of people who have registered for a product, service, or platform. It is commonly used to track the growth of a user base over time.
Sales and Revenue
Sales teams use these metrics to track prospect activity and the financial performance of the business.
- Demos Booked: The total number of product or service demonstrations scheduled with prospects. It is commonly used to measure sales activity and interest in an offering.
- Leads Generated: The total number of potential customers collected through sales or marketing activities. This can include leads captured through forms, campaigns, events, or other channels.
- Gross Revenue: The total income generated from sales before deducting expenses, costs, or other deductions. It provides an overview of the sales value generated during a specific period.
Vanity metrics show activity, but they don’t always reveal how effectively your team works.
Use Time Champ to gain clear visibility into employee activity and productivity.
The Risks of Relying on Vanity Metrics
Vanity metrics are easy to track and often look encouraging in reports. However, giving them too much importance can affect how teams assess performance, set priorities, and allocate resources. Here are some of the main risks of relying on them:
Misleading Performance Evaluation
Vanity metrics can create a positive impression even when actual business performance has not improved. This can make it difficult to assess whether a campaign, product, or strategy is delivering the expected results.
Poor Decision-Making
When decisions are based on numbers that have little connection to business goals, teams may invest time and resources in activities that do not deliver sufficient value. This can lead to ineffective strategies and missed opportunities.
Difficulty Identifying What Works
High-level numbers rarely explain which actions are responsible for better results. Without more relevant metrics, teams may struggle to identify successful strategies and determine where improvements are needed.
Wasted Resources
Focusing heavily on vanity metrics can direct budgets, time, and effort toward activities that increase visibility without improving business outcomes. Over time, this can reduce the return on marketing, sales, or product investments.
Misaligned Business Goals
Vanity metrics can shift attention toward gaining more views, followers, or sign-ups instead of achieving goals such as increasing revenue, improving retention, or acquiring valuable customers. This creates a gap between what teams measure and what the business needs to achieve.
How to Spot a Vanity Metric
Identifying vanity metrics requires looking at how a metric relates to business performance and day-to-day decisions. The following factors can help you distinguish useful metrics from numbers that mainly show activity.
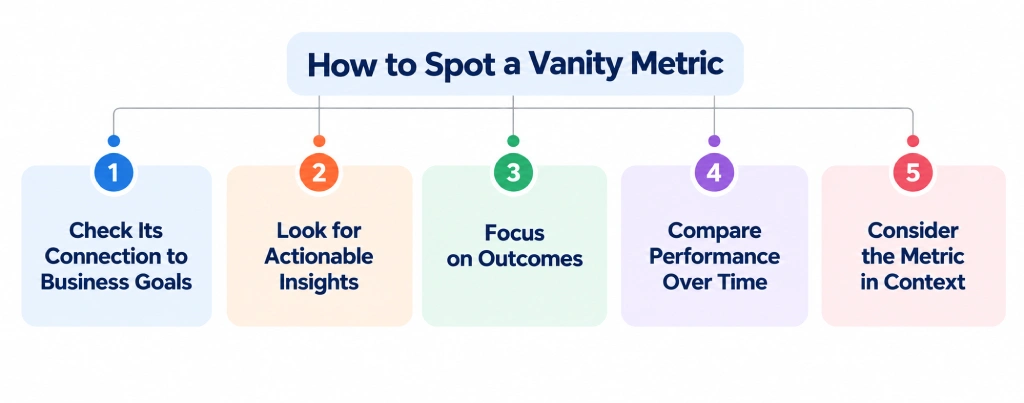
Check Its Connection to Business Goals
A useful metric should relate to a specific business goal, such as increasing revenue, improving retention, reducing costs, or acquiring customers.
- A metric should support a clear business objective.
- Metrics that only show audience size or activity may have limited business value.
- The importance of a metric can vary depending on the goal being measured.
Look for Actionable Insights
A valuable metric should help your team decide what to improve, change, or continue.
- The metric should provide information that teams can use to adjust their approach.
- Changes in the metric should help identify areas that need attention.
- Metrics that simply report activity without supporting a decision may be less useful.
Focus on Outcomes
Prioritize metrics that show the results of your efforts rather than activity alone.
- Outcome-based metrics connect activities with specific results.
- They can help teams evaluate whether a campaign, product, or strategy is working.
- For example, completed purchases provide a clearer view of sales performance than website visits alone.
Compare Performance Over Time
Tracking a metric across different periods helps you understand changes in performance.
- Compare current results with previous periods to identify trends.
- Review performance across campaigns, products, or customer groups when relevant.
- Consistent tracking makes it easier to recognize improvement or decline.
Consider the Metric in Context
A single metric rarely provides enough information to assess performance accurately.
- Pair related metrics to understand what is driving a result.
- Consider factors such as customer behavior, costs, conversion rates, and retention.
- For example, lead volume can be assessed alongside lead quality and conversion rate to evaluate sales performance.
How to Turn Vanity Metrics into Actionable Metrics
Vanity metrics become more useful when you add context and connect them to a specific business outcome. Instead of removing them from your reports, use them as a starting point and add the data needed to understand what is actually happening.
Add a Denominator or Ratio
Raw totals can be difficult to interpret on their own. Converting them into percentages or ratios gives you a clearer way to compare performance.
- Total page views → Conversion rate: Instead of only tracking page views, measure the percentage of visitors who complete a desired action.
- Total leads → Lead-to-customer rate: Measure the percentage of leads that become paying customers.
Segment the Data by Source or Cohort
Breaking a metric into smaller groups can show where results are coming from. Segment data by traffic source, campaign, customer type, location, or signup period.
For example, instead of looking at total leads, compare conversion rates by source to see which channels generate the strongest results.
Connect the Metric to a Business Goal
A metric becomes more useful when it is tied to a clear objective. Define what you want to achieve and choose a metric that helps measure progress toward it.
For example, if the goal is to increase revenue, connect website traffic to purchases and revenue generated rather than tracking traffic alone.
Track Trends Instead of Cumulative Totals
Cumulative numbers naturally increase over time, which can make growth appear stronger than it is. Track changes over specific periods to understand whether performance is actually improving.
For example, replace total registered users with monthly active users and monthly retention rate to see how user activity changes over time.
Measure Progress Over Time
Track the metric across consistent periods to identify trends and measure the effect of changes. For example, comparing conversion rates before and after a campaign can show whether the campaign improved results. Regular comparisons also help you identify patterns, spot declines early, and make timely adjustments to your strategy.
Turn Employee Activity into Measurable Outcomes with Time Champ
You need more than hours logged to understand how your team works. Time Champ is employee monitoring and productivity tracking software that helps you track work time, monitor activity, and gain clear insights into team productivity. You can use these insights to understand work patterns, identify areas that need attention, and improve how your team manages its time.
Key features include:
- Automatic Time Tracking: Records the time employees spend working throughout the day.
- Productivity Tracking: Helps you measure productive and unproductive work time.
- App and Website Tracking: Shows which applications and websites employees use during work hours.
- Automated Screenshots: Provides periodic screenshots to give you visibility into ongoing work.
- Attendance Tracking: Records employee attendance, work hours, and working patterns.
- Task Management: Helps you track tasks and monitor progress.
- Productivity Reports: Gives detailed reports to review employee and team performance.
Conclusion
A metric is only valuable when it helps you make a better decision. Focus on metrics that connect directly to your business goals, reveal actual outcomes, and help you decide what to improve. Replacing simple activity counts with actionable metrics makes your performance data more useful and helps you make better decisions.
If you are looking for a tool to track employee activity and measure productivity, Time Champ can be a practical solution.
Guna Lakshmi

Table of Content
 What Are Vanity Metrics?
- Vanity Metrics vs Actionable Metrics
- Common Examples of Vanity Metrics
- The Risks of Relying on Vanity Metrics
- How to Spot a Vanity Metric
- How to Turn Vanity Metrics into Actionable Metrics
- Turn Employee Activity into Measurable Outcomes with Time Champ
- Conclusion
Related Blogs

https://www.timechamp.io/blogs/author/guna-lakshmi/
Jahnavi Pulluri | Guna Lakshmihttps://www.timechamp.io/blogs/author/jahnavi-pulluri/
https://www.timechamp.io/blogs/how-to-measure-and-improve-call-center-productivity/ | Jahnavi Pulluri
Discover the ultimate guide to call centre workforce management. Learn key functions, pros, cons, optimisation tips, and how real-time WFM boosts ROI.
Thasleem Shaik | Oct 01, 2025
Discover the 10 best call centre quality assurance software for 2025. Compare features, pricing, pros, and cons to boost service quality and performance.
Thasleem Shaik | Nov 07, 2025
How to start a call center using a complete setup process covering costs, software, staffing, compliance, operations, and business planning.
Thasleem Shaik | Jul 29, 2026


 4.7/5 avg.
Ready to Manage Your Workforce Smarter?
Join our family of 1500+ companies using smart insights to redefine workforces!

Free Trial
No Credit Card Required