BPO KPIs: 15+ Key Metrics to Track for Better Performance
Track the most important BPO KPIs to measure agent performance, productivity, customer satisfaction, and overall contact center success in 2026.
Running a BPO without the right KPIs is a bit like driving without a speedometer. You know you’re moving, but you have no idea how well you’re doing. The right metrics help you track agent productivity, service quality, customer satisfaction, and overall efficiency.
In this guide, you’ll learn about 15 key BPO KPIs, what they measure, and how they can help you improve performance.
What Are BPO KPIs?
BPO KPIs are measurable values that help you evaluate the performance, productivity, and efficiency of your BPO operations. They help you track areas such as agent performance, customer satisfaction, service quality, response times, and operational costs.
These metrics give you a clear view of how well your teams and processes are performing. You can use them to spot performance gaps, set realistic targets, and measure progress over time. Tracking the right BPO KPIs also helps you understand where your operations are doing well and where improvements are needed.

Did You Know?
According to Gallup, highly engaged teams achieve 14% higher productivity and 10% higher customer loyalty or engagement. This highlights why employee and workforce KPIs matter when measuring BPO performance.
The Main Categories of BPO KPIs
You can group BPO KPIs into five categories based on what you want to measure. This makes it easier to choose the right metrics for your goals and understand where your operations are performing well or falling short.
At a glance, the main BPO KPI categories are:
- Productivity and efficiency
- Quality
- Customer experience
- Financial and SLA performance
- Agent and workforce performance
Productivity and Efficiency KPIs
These KPIs help you understand how efficiently your team handles its workload. They show how much time agents spend handling contacts, how well they follow schedules, and how much each interaction costs.
1. Average Handle Time (AHT)
Average Handle Time measures the average time you spend handling a customer interaction, including talk time, hold time, and after-call work. A lower AHT can indicate efficiency, but reducing it too much can affect service quality.
Formula:
AHT = (Total Talk Time + Total Hold Time + Total After-Call Work Time) ÷ Total Contacts Handled
You can compare AHT across agents, teams, or time periods to identify unusual increases. Reviewing AHT alongside customer satisfaction and FCR helps you avoid focusing on speed at the expense of service quality.
2. Occupancy Rate
Occupancy rate shows the share of an agent’s logged-in time spent handling contacts or completing related work. A high occupancy rate can indicate strong utilization, but consistently high levels may also increase agent fatigue.
Formula:
Occupancy Rate = (Total Time Handling Contacts ÷ Total Logged-in Time) × 100
You can use this metric to see whether your agents have enough productive work throughout their shifts. Very low occupancy may point to overstaffing, while consistently high occupancy can signal workload pressure.
3. Utilization and Schedule Adherence
Utilization shows how much of an agent’s available time is spent on productive work. Schedule adherence measures how closely agents follow their assigned schedules.
Utilization Formula:
Utilization = (Productive Time ÷ Total Available Time) × 100
Schedule Adherence Formula:
Schedule Adherence = (Time Spent Following Schedule ÷ Total Scheduled Time) × 100
These metrics help you identify scheduling gaps and make better use of your workforce. They can also help you determine whether staffing plans match actual workload patterns.
4. Cost per Contact or Transaction
This metric shows how much it costs you to handle each contact or complete each transaction. You can use it to track operating costs and identify opportunities to improve efficiency.
Formula:
Cost per Contact = Total Operating Cost ÷ Total Contacts Handled
Tracking this KPI over time can show whether your operating costs are increasing or decreasing. You can also compare it across teams or processes to find areas with higher costs.
Want better visibility into your BPO team's performance?
Time Champ helps you track work hours, productivity, attendance, and employee activity from one place.
Quality KPIs
Quality KPIs help you measure the accuracy, consistency, and standard of the service your team provides. They are useful for identifying training needs and process issues.
5. First Call Resolution (FCR)
First Call Resolution measures the percentage of customer issues resolved during the first contact without requiring a follow-up. A higher FCR can improve customer experience while reducing repeat contacts.
Formula:
FCR = (Contacts Resolved on First Interaction ÷ Total Contacts) × 100
A strong FCR can reduce the workload caused by repeat contacts and follow-ups. You should review it alongside AHT and CSAT to understand whether issues are being resolved efficiently and effectively.
6. Quality Assurance (QA) Score
QA scores show how well your agents meet your defined quality standards during monitored interactions. You can assess factors such as communication, accuracy, process adherence, and issue resolution.
Formula:
QA Score = (Points Earned ÷ Total Possible Points) × 100
You can use QA scores to identify individual and team-level training needs. Regular QA reviews also help you maintain consistent service standards across your BPO operation.
7. Accuracy and Error Rate
Accuracy measures how often work is completed correctly, while the error rate tracks the frequency of mistakes. These metrics are particularly important for back-office BPO processes.
Accuracy Formula:
Accuracy Rate = (Correct Transactions ÷ Total Transactions) × 100
Error Rate Formula:
Error Rate = (Incorrect Transactions ÷ Total Transactions) × 100
A high error rate can lead to rework, customer complaints, and additional operating costs. Tracking these metrics helps you identify recurring mistakes and address their underlying causes.
8. Compliance Rate
Compliance rate measures how consistently agents follow required procedures, scripts, disclosures, and regulatory requirements.
Formula:
Compliance Rate = (Compliant Interactions ÷ Total Interactions Reviewed) × 100
You can use this KPI to identify gaps in training or process adherence. A strong compliance rate also helps reduce the risk of penalties, customer complaints, and process failures.
Customer Experience KPIs
Customer experience KPIs show how customers perceive your service. They help you understand satisfaction, response speed, and where customers may be leaving without receiving assistance.
9. Customer Satisfaction (CSAT)
CSAT measures how satisfied customers are with a specific interaction or service. You typically collect this information through a short survey after the interaction.
Formula:
CSAT = (Satisfied Responses ÷ Total Survey Responses) × 100
You can track CSAT after specific interactions, services, or support cases. Comparing CSAT with other KPIs can help you understand which operational factors have the biggest effect on customer satisfaction.
Did You Know?
Gartner's customer service benchmarking research covers more than 300 customer service and support metrics, showing just how many factors can influence contact-center performance.
10. Net Promoter Score (NPS)
NPS measures how likely customers are to recommend your company or service to others. Customers are grouped as promoters, passives, or detractors based on their responses.
Formula:
NPS = % Promoters - % Detractors
You can use NPS to track customer loyalty over time. A declining score can encourage you to investigate recurring service issues or changes in customer expectations.
11. Service Level and Average Speed of Answer (ASA)
Service level measures whether you answer contacts within your target timeframe. Average Speed of Answer measures how long customers wait before reaching an agent.
Service Level Formula:
Service Level = (Contacts Answered Within Target ÷ Total Eligible Contacts) × 100
ASA Formula:
ASA = Total Waiting Time ÷ Total Answered Contacts
Together, these metrics help you assess the speed and reliability of your service. They can also help you identify whether staffing levels are keeping up with customer demand.
12. Call Abandonment Rate
Call abandonment rate measures the percentage of customers who disconnect before reaching an agent. A high abandonment rate can point to long wait times or staffing gaps.
Formula:
Call Abandonment Rate = (Abandoned Contacts ÷ Total Incoming Contacts) × 100
You can track this metric during busy periods to identify when customers are most likely to leave the queue. Reducing wait times and improving staffing coverage can help lower abandonment.
Financial and SLA KPIs
Financial and SLA KPIs help you connect operational performance with business outcomes. They show whether you are meeting client commitments while keeping costs under control.
13. SLA Adherence
SLA adherence measures how consistently you meet the service targets agreed upon with your client. These targets may cover response times, resolution times, availability, or other requirements.
Formula:
SLA Adherence = (Interactions Meeting SLA ÷ Total Eligible Interactions) × 100
You can use this KPI to track whether your team is meeting contractual service commitments. Regular monitoring also helps you address SLA risks before they affect client relationships.
14. Revenue or Output per Agent
This KPI measures the value or volume generated by each agent. Depending on your BPO model, you might track revenue, completed transactions, resolved cases, or another measurable output.
Revenue per Agent Formula:
Revenue per Agent = Total Revenue ÷ Number of Agents
Output per Agent Formula:
Output per Agent = Total Output ÷ Number of Agents
Tracking this metric helps you compare productivity across teams and periods. You can also use it to assess whether changes in staffing, training, or processes are improving output.
15. Outsourcing ROI and Cost Savings
Outsourcing ROI compares the value you gain from outsourcing with the cost of the service. Cost savings show how much you save compared with handling the same work internally.
Outsourcing ROI Formula:
ROI = ((Outsourcing Benefits − Outsourcing Cost) ÷ Outsourcing Cost) × 100
Cost Savings Formula:
Cost Savings = In-house Cost − Outsourcing Cost
These metrics help you assess whether outsourcing is delivering the expected financial value. You can review them regularly to determine whether the current outsourcing model remains cost-effective.
Agent and Workforce KPIs
Your workforce has a direct impact on BPO performance. These KPIs help you understand agent retention, attendance, productivity, and how effectively your available workforce is being used.
16. Agent Attrition and Turnover
Agent attrition or turnover measures the rate at which employees leave your organization. High turnover can increase recruitment and training costs while affecting productivity and service consistency.
Formula:
Agent Attrition Rate = (Number of Agents Who Left ÷ Average Number of Agents) × 100
Tracking attrition helps you understand whether employee retention is becoming a business challenge. You can compare this KPI with factors such as tenure, workload, and agent absenteeism to identify potential workforce issues.
17. Attendance and Shrinkage
Attendance tracks whether agents are present and available as scheduled. Shrinkage refers to the time when agents are unavailable for customer-facing work because of breaks, training, meetings, leave, or absenteeism.
Attendance Formula:
Attendance Rate = (Scheduled Hours Worked ÷ Scheduled Hours) × 100
Shrinkage Formula:
Shrinkage Rate = (Non-productive Hours ÷ Scheduled Hours) × 100
These metrics help you understand how much of your planned workforce is actually available for productive work. Accurate shrinkage data also helps you plan staffing levels and account for unavoidable non-productive time.
18. Agent Productivity
Agent productivity measures the amount of work completed relative to the time available. You can track outputs such as contacts handled, cases resolved, or transactions completed.
Formula:
Agent Productivity = Total Output ÷ Productive Hours
You can use this KPI to compare productivity across agents, teams, or shifts. Tracking it over time can also show whether training, process changes, or new tools are improving agent output.
Want to improve your BPO service quality and customer experience?
See how Time Champ helps you track productivity, attendance, work hours, and employee activity.
How to Read BPO KPI Benchmarks
Benchmarks help you compare your KPI results with commonly used performance ranges. They give you a quick way to see whether your performance is low, medium, or high and where you may need to improve.
Keep in mind that these ranges are general guidelines. Your ideal target can vary based on your industry, process, contact volume, and client requirements.
| Performance Level | Range | What It Means |
|---|---|---|
| Low | Below 70% | Performance may need attention or improvement |
| Medium | 70%-85% | Performance is within an acceptable range |
| High | Above 85% | Performance is strong and generally meets or exceeds expectations |
BPO KPI Summary Table (Formulas and Benchmarks)
The table below gives you a quick overview of the key BPO KPIs, their calculation methods, and useful benchmark ranges. Use these benchmarks as general reference points rather than fixed targets, since the right target can vary by industry, channel, service type, and client requirements.
| BPO KPI | Formula | General Benchmark |
|---|---|---|
| Average Handle Time (AHT) | (Talk Time + Hold Time + After-Call Work) ÷ Contacts Handled | 3 to 6 minutes |
| Occupancy Rate | (Contact Handling Time ÷ Logged-in Time) × 100 | 75% to 85% |
| Utilization | (Productive Time ÷ Available Time) × 100 | 70% to 85% |
| Schedule Adherence | (Time Following Schedule ÷ Scheduled Time) × 100 | 90% to 95%+ |
| Cost per Contact | Operating Cost ÷ Contacts Handled | Varies by service |
| First Call Resolution (FCR) | (First-contact Resolutions ÷ Total Contacts) × 100 | 70% to 80%+ |
| QA Score | (Points Earned ÷ Total Possible Points) × 100 | 85% to 95%+ |
| Accuracy Rate | (Correct Transactions ÷ Total Transactions) × 100 | 95% to 99%+ |
| Compliance Rate | (Compliant Interactions ÷ Interactions Reviewed) × 100 | 95% to 100% |
| CSAT | (Satisfied Responses ÷ Total Responses) × 100 | 75% to 85%+ |
| NPS | % Promoters − % Detractors | 30+ is generally considered good |
| Service Level | (Contacts Answered Within Target ÷ Eligible Contacts) × 100 | 80% in 20 seconds is a common target |
| ASA | Total Waiting Time ÷ Answered Contacts | 20 to 30 seconds |
| Call Abandonment Rate | (Abandoned Contacts ÷ Incoming Contacts) × 100 | 3% to 5% or lower |
| SLA Adherence | (Interactions Meeting SLA ÷ Eligible Interactions) × 100 | 95%+ |
| Revenue per Agent | Total Revenue ÷ Number of Agents | Varies by BPO model |
| Outsourcing ROI | ((Benefits − Outsourcing Cost) ÷ Outsourcing Cost) × 100 | Positive ROI |
| Agent Attrition Rate | (Agents Who Left ÷ Average Number of Agents) × 100 | Lower is better |
| Attendance Rate | (Scheduled Hours Worked ÷ Scheduled Hours) × 100 | 95%+ |
| Shrinkage Rate | (Non-productive Hours ÷ Scheduled Hours) × 100 | 25% to 35% |
| Agent Productivity | Total Output ÷ Productive Hours | Varies by process |
These benchmarks can help you set a starting point for your BPO operation. Your targets should ultimately reflect your service model, historical performance, client SLAs, and customer expectations.
How to Choose and Track the Right BPO KPIs
Choosing the right BPO KPIs starts with knowing what you want to measure and improve. Follow these steps to select useful metrics and track them consistently.
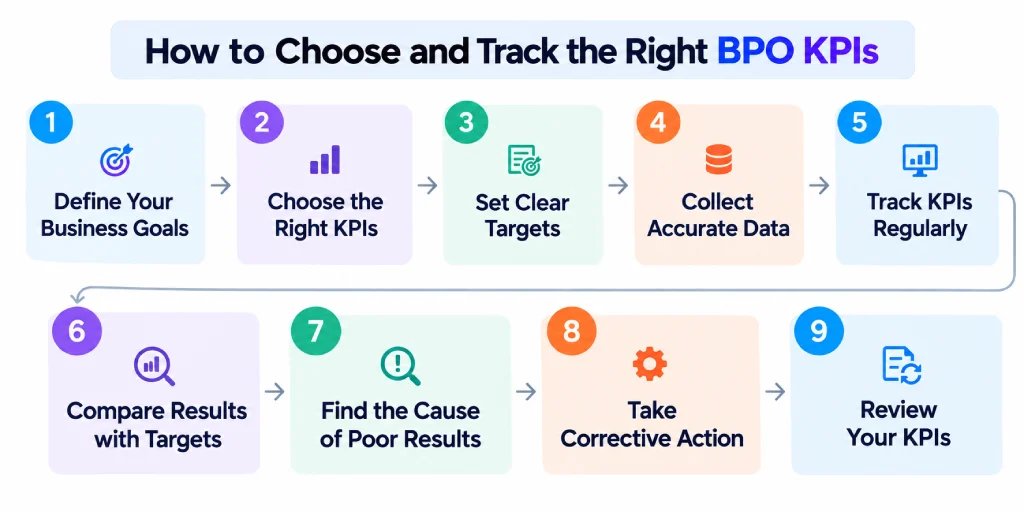
Step 1: Define Your Business Goals
Start by deciding what you want to improve or measure. Your goal could be reducing costs, improving customer satisfaction, increasing productivity, or meeting client SLAs.
Step 2: Choose the Right KPIs
Select KPIs that match your goals. For example, use AHT and occupancy rate to measure efficiency, or CSAT and FCR to measure customer experience.
Step 3: Set Clear Targets
Set a target for each KPI based on your past results, industry benchmarks, and client requirements. Keep your targets realistic and easy for your team to understand.
Step 4: Collect Accurate Data
Identify where the data for each KPI comes from and make sure it is recorded correctly. Use the same calculation method across teams so your results remain consistent.
Step 5: Track KPIs Regularly
Decide how often you need to review each KPI. You may track operational metrics daily, while workforce and financial metrics may be reviewed weekly or monthly.
Step 6: Compare Results with Targets
Compare your actual results with your targets and benchmarks. Pay attention to large gaps and sudden changes that could affect performance.
Step 7: Find the Cause of Poor Results
Look beyond the numbers to understand why a KPI is below target. Check factors such as staffing, workload, training, processes, technology, and customer demand.
Step 8: Take Corrective Action
Decide what needs to change based on your findings. You may need to adjust schedules, provide training, change a process, or improve workforce planning.
Step 9: Review Your KPIs
Review your KPI list regularly to make sure each metric is still useful. Update your targets when your business goals, processes, or client requirements change.
Get Clear Visibility into BPO Performance with Time Champ
Tracking BPO KPIs becomes easier when you have accurate data on how your team spends its working time. Time Champ is a BPO time tracking software that helps you track employee activity, productivity, attendance, and work hours from one place.
You can use these insights to monitor key BPO metrics and understand where your team’s time is going. It also helps you identify productivity gaps, track workforce performance, and make better staffing decisions.
Key Time Champ Features:
- Time Tracking to record working hours and active time, helping you measure productivity and utilization.
- Productivity Tracking to see how agents spend their work time and identify productivity gaps.
- Attendance Tracking to monitor working hours, absences, late arrivals, and attendance patterns.
- Employee Activity Tracking to understand how work time is being spent across applications and websites.
- Productivity Reports to compare individual and team performance and spot changes over time.
- Workforce Analytics to identify workload patterns and support staffing decisions.
Ready to improve your BPO team's performance?
Try Time Champ today and get the visibility you need to track productivity, manage your workforce, and make better decisions.
Conclusion
The right BPO KPIs help you understand productivity, quality, customer experience, costs, and workforce performance. Choose metrics that match your goals, set realistic targets, and track them regularly to spot gaps and improve results.
If you’re looking for a BPO tracking tool to monitor productivity, attendance, employee activity, and work hours, Time Champ is a strong solution. Try Time Champ today and get better visibility into your BPO team’s performance.

Guna Lakshmi

Table of Content
 What Are BPO KPIs?
- How to Read BPO KPI Benchmarks
- BPO KPI Summary Table (Formulas and Benchmarks)
- How to Choose and Track the Right BPO KPIs
- Get Clear Visibility into BPO Performance with Time Champ
- Conclusion
Related Blogs
Learn simple ways to measure and boost call center productivity, helping your team work more efficiently and improve customer service.
Jahnavi Pulluri | Jan 10, 2025
Explore top BPO companies offering tailored solutions. Find the right partner to boost efficiency, cut costs, and drive your business growth!
Mounika Sai | Nov 24, 2023
Learn how to kickstart your BPO business with this comprehensive step-by-step guide, covering everything from planning to execution. Get insights now!
Tarun Kumar Reddy | Nov 17, 2023
Explore the various types of Business Process Outsourcing (BPO) services, their benefits, and how they streamline operations for businesses.
Mounika Sai | Nov 21, 2023
Explore the most important productivity metrics and KPIs to measure employee performance, improve efficiency, and boost workplace productivity.
Anjali | May 12, 2026
Productivity metrics are becoming a norm for businesses and organizations of all sizes, but only because it gives managers, executives, some insight
Sai Keerthi Uppala | May 30, 2023


 4.7/5 avg.
Ready to Manage Your Workforce Smarter?
Join our family of 1500+ companies using smart insights to redefine workforces!

Free Trial
No Credit Card Required