10 Critical Productivity Metrics and KPIs (2026)
Explore the most important productivity metrics and KPIs to measure employee performance, improve efficiency, and boost workplace productivity.

You may already be tracking various productivity metrics across employee monitoring tools, project dashboards, and performance reports. But when too much data competes for attention, it becomes harder to identify which metrics reflect team performance, efficiency, and business impact. Tracking more numbers does not always lead to better decisions. Without the right productivity metrics, you can struggle with workload planning, performance evaluation, and productivity improvement.
This guide explains the difference between productivity metrics and KPIs, how to choose the right metrics for your team, and the 10 critical productivity metrics every business should track in 2026. You'll also learn common tracking mistakes, practical benchmarking methods, and effective ways to use productivity data for better workforce and performance decisions.
What Are Productivity Metrics and KPIs?
Productivity metrics are measurable data points used to evaluate how efficiently work is completed. At the same time, KPIs (Key Performance Indicators) are the specific metrics that organizations prioritize to measure progress toward important business goals. In simple terms, metrics help you monitor daily performance, and KPIs help you determine whether your team is moving in the right direction strategically. Although every KPI comes from a metric, not every metric deserves KPI status.
Most organizations track large volumes of workforce and operational data, but only a few should directly influence accountability, performance reviews, or business decisions. When you treat every metric as important, it becomes harder for your team to focus on the numbers that actually matter. Separating general metrics from true KPIs helps you concentrate on the data that drives performance and operational improvement.
How Do You Choose the Right Productivity Metrics for Your Team?
Choosing the right productivity metrics is not about tracking more data. It is about selecting measurements that help you make better decisions, improve team performance, and identify problems before they affect business outcomes. The most effective metrics give you clear visibility into how work is happening, where productivity gaps exist, and what actions can improve efficiency.
To build a useful productivity scorecard, focus on these four principles:
1. Choose Metrics Connected to Business Outcomes
Track metrics that clearly support a business goal such as productivity improvement, revenue growth, faster project delivery, or better employee performance. Before adding any metric to your dashboard, ask yourself what business impact it helps measure. If the metric does not influence a decision or outcome, avoid tracking it.
2. Balance Leading and Lagging Metrics
Use a mix of leading and lagging indicators to get a complete view of team performance. Lagging metrics show past results like completed tasks or revenue, while leading metrics help you identify future performance trends through indicators like focus time, workload balance, or activity patterns. Combining both helps you identify productivity issues early and make faster, more informed decisions.
3. Measure Both Individual and Team Performance
Track individual-level metrics to identify coaching needs, productivity trends, and skill gaps. At the same time, monitor team-level metrics to understand collaboration efficiency, workload distribution, and operational bottlenecks. Using both perspectives helps you make better performance and resource decisions.
4. Keep Metrics Simple and Measurable
Choose metrics that are easy to calculate, understand, and explain. Every metric should have a clear formula and a consistent method of measurement. Simple metrics improve reporting accuracy, reduce confusion, and make productivity data easier for you to act on.
Struggling to identify which productivity metrics actually matter for your team?
Time Champ helps you track the right metrics with real-time workforce insights from one dashboard.
10 Critical Productivity Metrics Every Team Should Track
Tracking the right productivity metrics helps you understand how efficiently your team works, where performance gaps exist, and what areas need improvement. These 10 critical metrics give you a clearer view of productivity, workload balance, work quality, and overall team performance.
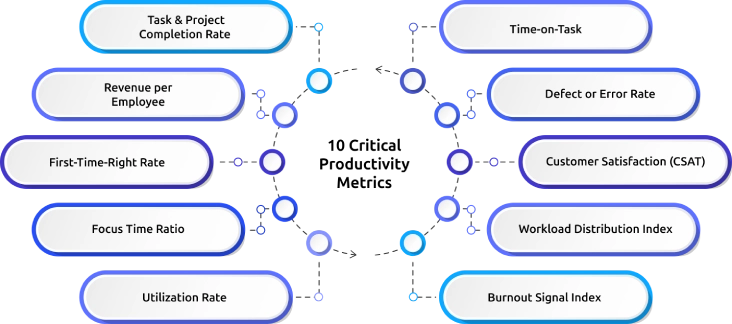
1. Task & Project Completion Rate
Task and Project Completion Rate measures how consistently your team finishes assigned work within a specific period. This metric helps you understand delivery performance, operational efficiency, and whether projects are progressing as planned. A low completion rate may indicate workload imbalance, unclear priorities, or process bottlenecks.
Formula:
Completion Rate = (Completed Tasks or Projects ÷ Total Assigned Tasks or Projects) × 100
Example:
(45 ÷ 50) × 100 = 90%
Here, the acquired result is 90%, which means the team completed most of the assigned work within the selected timeframe. A higher completion rate usually indicates stronger task management and workflow efficiency.
2. Revenue per Employee
Revenue per Employee measures how much revenue each employee generates for the business over a specific period. This metric helps you evaluate workforce efficiency, operational productivity, and overall business performance. Higher values often indicate better resource utilization and productivity.
Formula:
Revenue per Employee = Total Revenue ÷ Total Number of Employees
Example:
$2,000,000 ÷ 40 = $50,000
This result shows that each employee contributes an average of $50,000 in revenue to the business. Higher revenue per employee often reflects stronger workforce productivity and operational efficiency.
3. First-Time-Right Rate
First-Time-Right Rate measures how often work is completed correctly on the first attempt without rework, corrections, or quality issues. This metric reflects process efficiency, work accuracy, and quality control performance across teams.
Formula:
First-Time-Right Rate = (Tasks Completed Correctly on First Attempt ÷ Total Tasks Completed) × 100
Example:
(180 ÷ 200) × 100 = 90%
A 90% first-time-right rate indicates that most tasks were completed correctly without requiring rework or corrections. Higher values usually reflect better work quality and process accuracy.
4. Focus Time Ratio
Focus Time Ratio measures how much of an employee’s workday is spent on uninterrupted, productive work. This metric helps you understand concentration levels, deep work patterns, and the impact of distractions on productivity.
Formula:
Focus Time Ratio = (Focused Work Time ÷ Total Work Time) × 100
Example:
(4.5 ÷ 8) × 100 = 56.25%
This means the employee spent more than half of the workday on uninterrupted, focused work. Higher focus time ratios generally indicate better concentration and fewer workplace distractions.
5. Utilization Rate
Utilization Rate measures how much of an employee’s available working time is spent on productive or billable tasks. This metric helps you evaluate workforce capacity, resource allocation, and operational efficiency.
Formula:
Utilization Rate = (Billable Hours ÷ Total Available Hours) × 100
Example:
(30 ÷ 40) × 100 = 75%
A utilization rate of 75% shows that most available work hours were spent on productive tasks. Balanced utilization rates help improve efficiency without creating excessive workload pressure.
6. Time-on-Task
Time-on-Task measures the amount of time employees spend actively working on assigned tasks or projects. This metric helps you identify productivity patterns, task complexity, and workflow efficiency across teams.
Formula:
Time-on-Task = Total Active Task Time ÷ Number of Tasks
Example:
120 ÷ 3 = 4 hours per task
This result shows that the team spends an average of four hours completing each task. Tracking this metric helps you identify workflow delays, inefficient processes, and resource planning challenges.
7. Defect or Error Rate
Defect or Error Rate measures how frequently mistakes, defects, or quality issues occur during work processes. This metric helps you evaluate accuracy, process quality, and operational consistency.
Formula:
Defect Rate = (Total Defects or Errors ÷ Total Work Output) × 100
Example:
(25 ÷ 1000) × 100 = 2.5%
A 2.5% defect rate means only a small portion of the total work output contains errors or quality issues. Lower defect rates generally indicate stronger quality control and process consistency.
8. Customer Satisfaction (CSAT) per team
Customer Satisfaction Score measures how satisfied customers are with the service, support, or deliverables provided by a specific team. This metric helps evaluate customer experience, service quality, and team effectiveness.
Formula:
CSAT Score = (Positive Customer Responses ÷ Total Survey Responses) × 100
Example:
(108 ÷ 120) × 100 = 90%
This score shows that most customers reported positive experiences with the team’s service or support. Higher CSAT scores usually reflect stronger customer relationships and service quality.
9. Workload Distribution Index
Workload Distribution Index measures how evenly tasks and responsibilities are shared across team members. This metric helps identify workload imbalance, overutilization, and operational inefficiencies.
Formula:
Workload Distribution Index = Highest Individual Workload ÷ Average Team Workload
Example:
60 ÷ 40 = 1.5
A workload distribution index of 1.5 indicates that some employees are handling significantly more work than the team average. Higher values may signal workload imbalance and burnout risks.
10. Burnout Signal Index
The Burnout Signal Index measures patterns that may indicate employee fatigue, stress, or overwork. This metric combines indicators such as overtime hours, low focus time, excessive workload, and reduced engagement levels to identify burnout risks early.
Formula:
Burnout Signal Index = (Overtime Hours + High Workload Indicators + Low Engagement Signals) ÷ Total Employees
Example:
(120 + 40 + 20) ÷ 20 = 9
This result suggests increasing workload pressure and possible employee fatigue across the team. Rising burnout signal scores often indicate the need for workload adjustments and better workforce support.
Mistakes to Avoid When Tracking Productivity Metrics
You may collect productivity data regularly, but poor tracking practices often make the data difficult to use effectively. Avoiding these common mistakes can help you build a productivity dashboard that supports better decisions and meaningful performance improvement.
1. Tracking Too Many Metrics
- Tracking too many productivity metrics creates dashboard clutter and makes it difficult to focus on meaningful performance data.
- Limit your dashboard to the most important metrics that directly support business goals and team productivity.
2. Treating Every Metric Like a KPI
- Treating every metric like a KPI reduces clarity and weakens accountability across the team.
- Select a small group of KPIs for performance tracking and use the remaining metrics mainly for analysis and decision-making.
3. Setting Metrics Without Clear Benchmarks
- Tracking metrics without clear benchmarks makes it harder to measure progress or identify improvement areas.
- Set realistic targets and measurable benchmarks so your team clearly understands expected performance levels.
4. Ignoring the Real Cause Behind Productivity Changes
- Responding to low productivity numbers without investigating the real cause can encourage unhealthy work behaviors.
- Use productivity metrics to identify workload issues, process gaps, and operational bottlenecks before taking action.
How Do You Set Realistic Productivity Benchmarks for Your Industry?
Setting realistic productivity benchmarks begins with understanding how your own team operates, not blindly following industry averages. The most effective benchmarks help you measure consistent improvement, identify performance trends, and create achievable goals without putting unnecessary pressure on employees. These three approaches can help you build more accurate and practical productivity benchmarks for your team.
Approach 1: Start with Your Internal Performance Baseline
Begin by collecting a few weeks of clean productivity data and use your team’s average performance as the starting benchmark. Internal benchmarks are often more reliable because every team works differently based on workload, tools, industry demands, and work style. Your own data gives you a more realistic foundation for measuring improvement.
Approach 2: Use Industry Benchmarks as Reference Points
Use external productivity research to understand broader workplace trends, but avoid treating industry averages as fixed targets for your team. For example, recent Microsoft workplace research found that employees face interruptions from meetings, emails, or chat notifications every two minutes on average, which can heavily affect focus and productivity. Using insights like these helps to compare trends and evaluate performance realistically while prioritizing your team’s actual workload, work style, and operational environment.
Approach 3: Focus on Continuous Quarter-Over-Quarter Improvement
Compare your team’s current performance with its previous quarter and aim for steady, realistic improvement over time. Small gains in metrics like task completion, focus time, workload balance, or project delivery often provide more meaningful progress than trying to match broad industry averages.
How Does Time Champ Help Track Productivity Metrics?
Tracking productivity metrics becomes difficult when your workforce data is scattered across multiple tools, spreadsheets, and disconnected reports. Time Champ is an employee monitoring software with built-in workforce intelligence features that give you complete visibility into how work happens across your organization. It gives you a complete view of how work happens across your team by tracking work hours, focus time, app usage, attendance, task activity, and workload patterns in one place. This makes it easier for you to measure productivity, identify performance gaps, and understand how efficiently your teams are working without switching between multiple tools or reports.
Time Champ helps you understand how your team actually works day to day. You can spot productivity trends, identify workload imbalances, compare role-based performance, and set realistic productivity benchmarks using clear workforce insights from a single platform. You can track performance changes early, identify operational bottlenecks, improve resource planning, and make faster workforce decisions using real-time analytics. With enterprise-grade compliance standards including GDPR, ISO 27001:2022, HIPAA, and SOC 2 Type I, Time Champ also helps you manage workforce productivity securely and responsibly.
Finding it difficult to measure team performance without micromanaging employees?
Time Champ gives you visibility into productivity, focus time, workload balance, and team efficiency in one place.
Conclusion
Tracking the right productivity data can help you improve team performance, reduce operational inefficiencies, and make better workforce decisions with greater confidence. The key is not collecting more numbers but focusing on the metrics that clearly reflect work quality, efficiency, workload balance, and business impact.
When you build a structured approach to measuring performance, your team gains better visibility into what drives results and where improvements are needed. Clear benchmarks, meaningful KPIs, and consistent analysis also make productivity tracking more actionable across departments.
Using the right productivity metrics can help you create a more focused, accountable, and high-performing workplace while avoiding the confusion that comes from tracking unnecessary data.

Anjali

Table of Content
 What Are Productivity Metrics and KPIs?
- How Do You Choose the Right Productivity Metrics for Your Team?
- 10 Critical Productivity Metrics Every Team Should Track
- Formula:
- Formula:
- Example:
- Formula:
- Formula:
- Formula:
- Example:
- Formula:
- Example:
- Formula:
- Example:
- Formula:
- Example:
- Formula:
- Formula:
- Example:
- Mistakes to Avoid When Tracking Productivity Metrics
- How Do You Set Realistic Productivity Benchmarks for Your Industry?
- How Does Time Champ Help Track Productivity Metrics?
- Conclusion
Related Blogs

Learn how to track productivity in the workplace using proven methods, role-based metrics, and tools. A practical 2026 guide for modern managers and teams.
Jahnavi Pulluri | May 06, 2026
Track the right remote worker productivity metrics to understand performance, improve output, and avoid micromanagement with clear insights.
Thasleem Shaik | Apr 24, 2026
Discover 20 essential employee performance metrics to track. Learn how to measure and implement these metrics to boost productivity and drive success.
Shabana Shaik | August 08, 2025
Enhance productivity with insightful reports. Streamline workflow, achieve goals efficiently, and unlock your full potential!
Shabana Shaik | Jun 03, 2024
Workforce productivity analytics turns daily work data into clear decisions. Learn the key metrics, monitoring signals, and AI tools that improve team output.
Thasleem Shaik | Apr 21, 2026
Explore employee performance monitoring types, effective methods, common mistakes, and practical ways to improve overall team performance for modern workplaces.
Anjali | May 08, 2026


 4.7/5 avg.
Ready to Manage Your Workforce Smarter?
Join our family of 1500+ companies using smart insights to redefine workforces!

Free Trial
No Credit Card Required