Remote Worker Productivity Metrics: What to Track
Track the right remote worker productivity metrics to understand performance, improve output, and avoid micromanagement with clear insights.

Most teams think they’re tracking remote worker productivity, but they end up tracking presence, logins, hours, and activity that look productive but do not reflect real output. The gap between what you track and what actually drives output creates a false impression. You assume work is moving forward because employees stay online for long hours, but tasks slow down, priorities shift without clarity, and delivery timelines become unreliable.
High performers go unnoticed while disengagement continues in the background until it affects quality, deadlines, or retention. When you rely on the wrong remote team productivity metrics, you either start controlling work too closely or lose visibility into what actually drives results, and both outcomes weaken performance over time.
Remote work changes how you measure productivity. You cannot rely on physical visibility, so you need clear signals that show real progress and contribution. Focus on output, task completion, quality, and consistent work patterns instead of only tracking time or activity. This guide explains the remote worker productivity metrics that matter, why each one is important, and how to use them to make clear decisions without creating constant oversight.
Why Does Measuring Remote Productivity Require a Different Approach?
In an office, you can easily see how work is progressing through everyday interactions. Engagement, collaboration, and progress become easy to notice through everyday interactions. Remote work removes that layer of visibility, so presence or activity alone cannot explain how work is progressing. To understand performance, you need to focus on the right data signals instead of relying on observation.
Due to this change, the number of hours worked or being online does not provide a clear picture of performance. Remote productivity depends on how tasks move from start to completion, how consistently work progresses, and how effectively time translates into results. Without direct visibility, focus on signals like output, quality, and work patterns to clearly understand what is actually happening and where improvement must happen.
What Are the Right Categories of Remote Productivity Metrics?
Not all remote productivity metrics carry the same weight, and when you treat them as one list, it leads to poor decisions. Some metrics show activity during work sessions. Others show whether the team completes meaningful work. Here are the three key categories that define remote productivity.
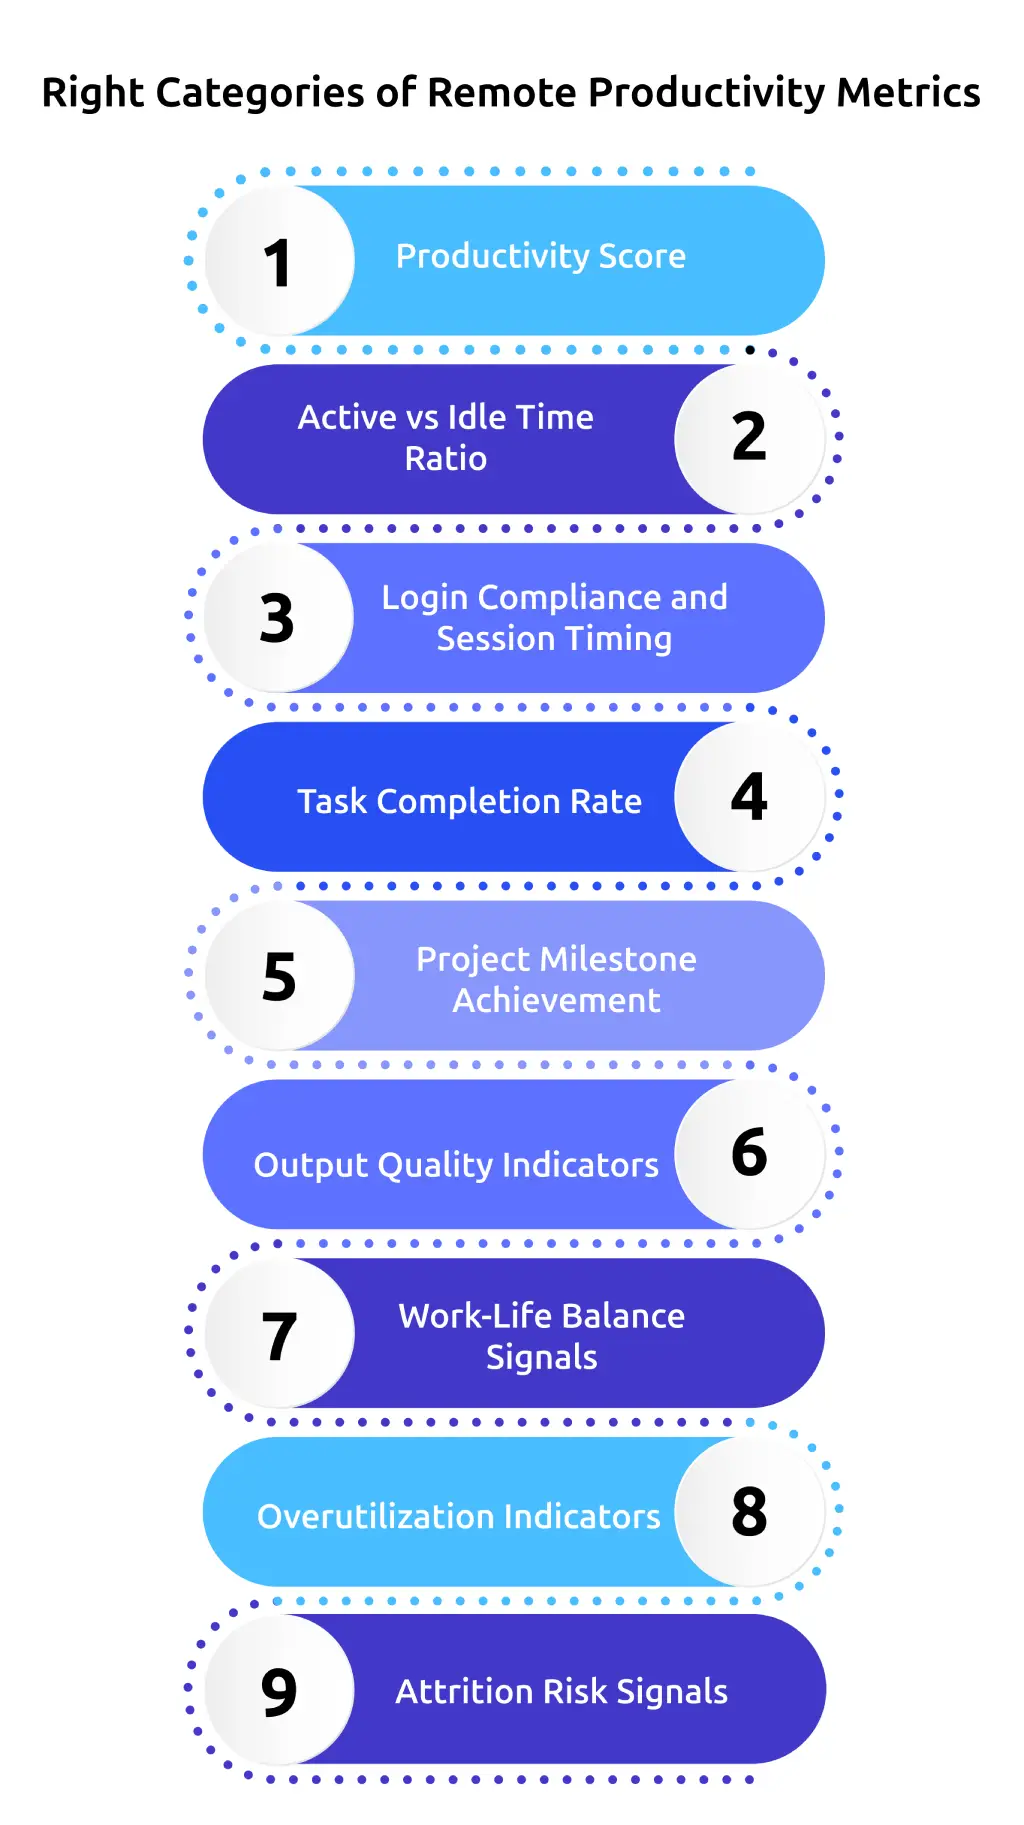
Category 1: Activity and Engagement Signals
These metrics replace the visibility a physical office provides, and help you understand who is working, when work happens, and where time goes.
A. Productivity Score
Productivity score tracks the percentage of work time spent in applications and websites that match the requirements of a specific role. What counts as productive work differs by role, for example, a developer uses different tools compared to a customer support role, which makes role-based classification essential. When this score drops consistently over multiple weeks, it often signals a change in work patterns before delays or output issues appear.
B. Active vs Idle Time Ratio
The active vs. idle time ratio goes deeper into how teams use work time. It shows whether work remains consistent during logged hours or drops into long inactive periods. When login time stays high but idle time also remains high, it shows that time is available but not consistently used for focused work. The active-idle ratio helps identify when time is present but not effectively used.
C. Login Compliance and Session Timing
Login compliance and session timing reflect how consistently work follows expected schedules. Frequent delays in start times or irregular work patterns across days indicate early signs of disengagement. These patterns appear in timing data before they affect deliverables.
Category 2: Output and Delivery Metrics
This is where accountability becomes clear. Activity metrics show how teams spend work time. Output metrics show what that work produces.
D. Task Completion Rate
Task completion rate is the percentage of assigned tasks that teams complete on time within a defined period. It is the most direct measure of execution reliability. This metric shows whether plans convert into actual delivery. Consistent completion supports better forecasting, staffing decisions, and cross-team coordination.
E. Project Milestone Achievement
Project milestone achievement operates on a longer timeline than task completion. It shows whether work meets larger commitments, not just daily tasks. For remote teams, predictability plays a critical role in maintaining steady delivery. Consistent milestone achievement reduces escalations, last-minute scope changes, and urgent rework. When teams miss milestones repeatedly, it often points to capacity planning issues, unrealistic deadlines, or coordination gaps that do not appear at the task level.
F. Output Quality Indicators
Output quality indicators measure the standard of delivered work using data from project management tools, client feedback, peer reviews, and QA reports. This metric captures a common remote challenge where activity appears stable, and tasks meet deadlines, but quality gradually declines. When quality drops while other metrics remain steady, it often indicates unclear expectations, skill gaps, or workloads that exceed sustainable limits.
Category 3: Work Pattern and Well-Being Signals
Teams often ignore this category until burnout or attrition becomes visible, even though the data shows early warning signs well before these issues affect performance.
G. Work-Life Balance Signals
Work-life balance signals track start and end times against expected working hours. Frequent late starts and extended hours indicate structural issues and rising burnout risk. This matters because 47% of remote workers report blurred work-life boundaries, and 34% feel pressure to stay available beyond working hours.
H. Overutilization Indicators
Overutilization indicators look at whether the total volume of assigned work remains sustainable over time. A remote worker may appear highly productive in the short term while gradually losing focus, energy, and engagement. This often leads to disengagement or attrition if it continues unchecked. Tracking work duration trends, after-hours activity, and weekend work patterns helps identify early warning signs before these issues affect performance.
I. Attrition Risk Signals
Attrition risk signals bring together data from multiple metrics, such as productivity trends, idle time, irregular work timing, and engagement patterns, to indicate potential disengagement. This helps you identify early signs of disengagement in remote environments where you lack direct visibility. Declining involvement shows up through changes in activity patterns, inconsistent work timing, and reduced quality, giving you enough time to act before it impacts overall performance.
Get clarity on work patterns, output, and performance in one place.
Use Time Champ to manage remote teams and improve productivity with real-time insights.
How Do You Track Remote Work Productivity Metrics Without Micromanaging?
Tracking productivity should give clarity, not create pressure. The difference comes from how you use the data. When you focus on outcomes, patterns, and decisions instead of constant observation, metrics become a support system instead of control. Here is how to do that.
1. Use Alerts, Not Constant Checks
You should not check dashboards every day because that leads to micromanagement. Instead, set clear thresholds for key metrics, like a productivity score dropping below 50% for three consecutive weeks, idle time crossing 30%, or login patterns becoming inconsistent. Alerts notify you when these changes happen, so you can review data only when it actually needs attention.
2. Focus on Trends Over Daily Data
A single low-productivity day does not give a reliable picture. Work patterns vary across days due to meetings, shifting priorities, or different stages of a task. A consistent decline in productivity scores over three to four weeks provides a clear indication that performance needs attention. Review multi-week trends instead of daily snapshots, as they provide a more accurate view of performance changes over time.
3. Let Employees See Their Own Data
Sharing data with employees is the step most teams skip, and it matters the most. When you give employees access to their own productivity scores, work patterns, and activity breakdowns, they start identifying issues and correcting them on their own. A developer who notices consistently high idle time does not need a separate conversation to recognize the problem, because the data already shows what needs to change. When you share this data, you remove the information gap and make expectations clear, which helps employees take ownership of their performance.
4. Use Data to Guide Conversations
A declining productivity trend is not a final judgment. It points to a change that needs attention. When you notice a shift in the data, start with a conversation instead of jumping to conclusions. Discuss workload, check for tool-related challenges, and understand if priorities or conditions have changed. The data shows when to step in, but the conversation helps you understand what is actually causing the change.
5. Review Output Alongside Activity
Activity and output metrics need to stay connected. A strong productivity score with falling task completion shows work is active but not delivering results. Consistent delivery with extended working hours points to performance that is not sustainable. Reviewing both together gives a clear view of performance, while focusing on only one leads to incomplete decisions.
Which Productivity Metrics Work Best for Different Remote Roles?
Not every role needs the same set of remote worker productivity metrics. The nature of work changes what you should measure. If you track the wrong metrics, you either miss performance gaps or misread strong work as weak. The right approach is to align metrics with how each role performs work.
1. Development and Technical Roles
Focus on output and progress-based remote team productivity metrics. Task completion rate, milestone achievement, and output quality indicators give a clear view of delivery. Activity data like productivity score supports this, but output should carry more weight. Technical work often includes deep focus time, so low activity at certain hours does not always indicate low performance.
2. Customer Support and BPO Roles
Use real-time and efficiency-focused remote work productivity tracking. Active vs idle time, login consistency, and productivity score matter more because work depends on availability and responsiveness. Task completion still matters, but activity patterns play a stronger role in understanding performance.
3. Creative and Marketing Roles
Balance output with quality-focused metrics. Task completion and deadlines matter, but output quality indicators and revision cycles give a clearer view of performance. Keep activity metrics secondary because creative work does not follow fixed patterns.
4. Sales and Client-Facing Roles
Focus on outcome-driven remote worker KPIs. Deal closures, response time, follow-ups, and client interaction outcomes define performance. Activity data supports context but does not reflect actual success. Use these outcome metrics to evaluate whether efforts convert into results and whether targets are consistently met.
5. Leadership and Strategy Roles
Rely on high-level remote team performance metrics such as milestone achievement, project progress, and decision impact. Activity-based tracking has limited value here. Evaluate whether strategic goals move forward as planned, whether teams stay aligned with priorities, and whether execution stays consistent across projects.
How Does Time Champ Help You Track Remote Worker Productivity?
Tracking remote worker productivity becomes difficult when data stays scattered across tools or lacks a clear structure. You need a system that brings activity, output, and work patterns together so you can understand how work progresses without jumping between multiple dashboards.
Time Champ works as a workforce intelligence platform with built-in employee monitoring, time tracking, and productivity tracking capabilities. It tracks productivity scores based on role-specific app usage, shows active and idle time patterns, and gives a clear breakdown of how teams use time across tools. You can see task completion trends, work timing patterns, and early signs of overwork or disengagement in one place. Instead of manually reviewing data every day, alerts highlight when changes happen, so you focus only on what needs attention and make decisions based on clear, structured insights.
Conclusion
Remote worker productivity becomes clear when you track the right metrics and read them in context. Activity shows how work happens, output shows what teams deliver, and work patterns show whether performance can continue without risk. When you combine these signals and review them consistently, you avoid guesswork and make better decisions without constant monitoring. The goal is not to track more data, but to focus on the metrics that reflect real work and use them to keep performance steady and sustainable.
Turn raw work data into clear performance insights.
Use Time Champ to see what drives output and act with confidence.

Thasleem Shaik
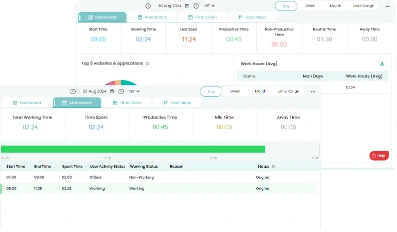
Table of Content
-
 Why Does Measuring Remote Productivity Require a Different Approach?
-
What Are the Right Categories of Remote Productivity Metrics?
-
How Do You Track Remote Work Productivity Metrics Without Micromanaging?
-
Which Productivity Metrics Work Best for Different Remote Roles?
-
How Does Time Champ Help You Track Remote Worker Productivity?
-
Conclusion
Related Blogs

Learn how employee monitoring supports work-life balance by detecting overwork, protecting boundaries, and helping teams build sustainable work patterns.
Anjali | Apr 23, 2026
Explore employee burnout detection software to help remote teams spot early warning signs, reduce turnover, and protect team well-being with the best tools.
Anjali | Apr 23, 2026
Analyzing employee monitoring data turns raw activity into decisions that improve performance. See the step-by-step framework, common mistakes, and how to act on what you find.
Thasleem Shaik | Apr 23, 2026
Track the right employee monitoring metrics to understand work patterns, improve performance, and make data-driven decisions with confidence.
Thasleem Shaik | Apr 22, 2026
Explore features of employee monitoring tools, including tracking, security, and productivity insights, to choose the right solution.
Thasleem Shaik | Apr 21, 2026
Understand employee monitoring legal compliance, key laws, and best practices to track work activity while protecting privacy and avoiding legal risks.
Thasleem Shaik | Apr 14, 2026Ready to Manage Your Workforce Smarter?
Join our family of 1500+ companies using smart insights to redefine workforces!
Free Trial
No Credit Card Required