How to Analyze Employee Monitoring Data Effectively
Analyzing employee monitoring data turns raw activity into decisions that improve performance. See the step-by-step framework, common mistakes, and how to act on what you find.

You collect employee monitoring data every day, yet you still struggle to understand what actually drives output. Raw numbers pile up across dashboards, but they fail to explain where time goes, which workflows slow progress, or why performance fluctuates. Investments in employee monitoring metrics pay back when leadership starts asking better questions of the data. Anyone weighing this decision usually starts with our enterprise employee monitoring guide for the full landscape.
That gap creates costly blind spots. You may track hours without knowing how those hours convert into meaningful work. You may see activity spikes without identifying real productivity. Decisions based on incomplete insights lead to missed deadlines, uneven workloads, and unclear accountability.
You need a clear way to turn monitoring data into actionable insight. This guide shows you how to analyze employee monitoring data with precision, so you can connect time, behavior, and output without guesswork.
What Does Employee Monitoring Data Actually Contain?
The employee monitoring software creates four different layers of data, and each of them answers a different question about the way your team works. Before you start analyzing anything, you need to know which layer you are looking at, because each one reveals a specific aspect of work behavior and performance.
1. Activity Data
Activity tracking captures what your team does during work hours. It records which applications employees open, which websites they visit, how long they spend on each, and how their activity spreads across the day. You can view app and website usage, compare active time with idle time, and track work patterns hour by hour. This data helps you understand what actually happens during work hours.
2. Productivity Data
Productivity data transforms raw activity into a valuable signal by identifying each application as productive, non-productive, or neutral, depending on the role of the employee. The output is a productivity score that reflects how well work time is being used, not just whether work stays active. This layer answers the question of how productively your team spends its work time.
3. Operational Data
Operational data includes the information on how and when your team works against its structure. It tracks login times against scheduled shift starts, attendance compliance, work duration against defined hours, overtime frequency, and break patterns. This layer will answer whether your team is functioning based on its schedule and structure.
4. Behavioral Data
Behavioral data pulls patterns from all three layers above and turns them into forward-looking insights about where your team is heading. Attrition prediction scores, burnout risk indicators, and disengagement indicators all exist in this layer. Rather than telling you what happened today, this layer shows what is likely to happen next, specifically which team members need support before a problem becomes visible. This layer answers the question of where your team is heading, and who needs attention before it shows up as a performance issue.
See what your data actually means, not just what it shows.
Use Time Champ to turn insights into real performance improvements.
What Is the Right Framework for Analyzing Employee Monitoring Data?
You cannot rely on raw data alone to understand how work happens. You need a clear structure that connects activity, productivity, and outcomes. A clear framework helps you turn disorganized data points into informed decisions without guesswork.
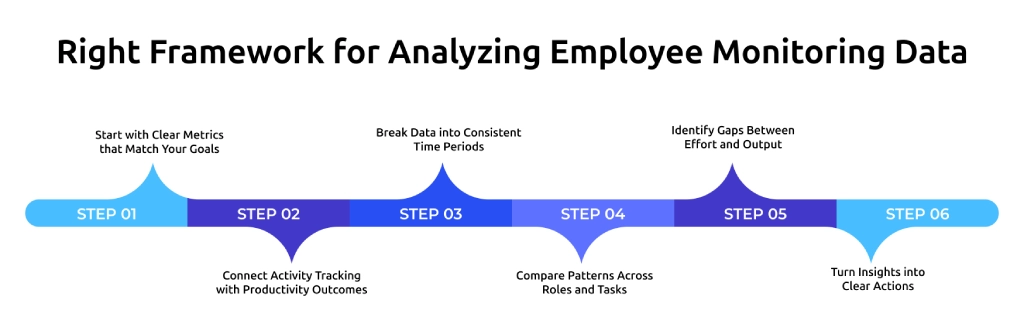
1. Start with Clear Metrics that Match Your Goals
Define the right metrics before analyzing any data. Focus on indicators such as active time, productive time, task completion, and focus duration, and connect them directly to business outcomes. Clear metrics remove unnecessary data and help you understand whether effort leads to real results instead of just tracking activity.
2. Connect Activity Tracking with Productivity Outcomes
Activity tracking shows where time goes, but real insight comes from linking it to output. Connect app usage and work patterns with productivity scores and deliverables to see whether time spent leads to progress. Linking activity to output helps you distinguish between busy work and meaningful work.
3. Break Data into Consistent Time Periods
Analyze data across daily, weekly, and monthly views instead of isolated moments. A structured time analysis helps you find trend changes, repeated patterns, and unexpected behaviors in work behavior. This will enhance accuracy and eliminate guesswork in the decisions.
4. Compare Patterns Across Roles and Tasks
Evaluate data based on roles and task types to avoid misleading conclusions. Different roles have different work patterns, so comparing similar roles gives you the right insights. Role-based comparison helps you set realistic benchmarks and identify role-specific improvements.
5. Identify Gaps Between Effort and Output
Check where high activity does not lead to results and where low activity still produces strong outcomes. These gaps reflect work inefficiencies, bottlenecks, and patterns of high performance. Understanding this difference helps you improve workflows and focus on what drives results.
6. Turn Insights into Clear Actions
Convert data insights into specific actions such as adjusting workloads, improving workflows, or supporting focused work. Clear action ensures that analysis leads to measurable improvements. Consistent decisions based on data help you improve performance without relying on assumptions.
What Are the Most Common Misreads of Employee Monitoring Data?
Misreads usually happen when you look at isolated metrics without context or when you assume activity equals performance. You need to understand where these mistakes occur so you can avoid drawing misleading conclusions.
| What the Data Shows | Common Misread | What It Actually Means | Correct Action |
|---|---|---|---|
| Active time rises, task completion falls | The team is working harder | Employees are optimizing for the tracked metric rather than doing productive work. This is performative busyness, not a productivity gain. | Check whether the monitoring setup creates incentives to manipulate activity metrics. Add output-based measures alongside activity data. |
| Productivity score drops in one week | The employee is underperforming | A single-week dip is not meaningful on its own. The cause could be a workload spike, a temporary distraction, or an external factor unrelated to performance. | Wait to see if the dip extends to three or more consecutive weeks before treating it as a performance issue. |
| Idle time rises on Fridays across the team | The team is slacking at the end of the week | This is a structural pattern, not individual behavior. Meeting-heavy weeks, end-of-sprint fatigue, or workload that compounds across the week all produce this signal. | Review Friday workload distribution and meeting volume. Fix the structural cause rather than addressing individual behavior. |
| One employee has the highest active time on the team | That employee is a top performer | High active time combined with extended session lengths often signals overload, not strong performance. The employee may be working excessive hours to stay on track. | Cross-reference active time with session length, overtime frequency, and work-life balance data before drawing any conclusion. |
| Attrition risk scores rise across multiple employees at the same time | Several employees are individually disengaged | When multiple attrition risk scores rise simultaneously with no individual-level trigger, it points to a team-level culture or workload problem, not separate individual issues. | Treat this as a structural or cultural signal. Bring in HR for a team-level review rather than running separate individual conversations. |
How Do You Build a Review Cadence That Actually Works?
Reviewing monitoring data once a quarter or only when something goes wrong turns the data into a reaction tool rather than a planning tool. The most effective approach runs at three consistent intervals, daily, weekly, and monthly, where each level handles a different type of decision.
1. Daily Review
The daily review focuses on areas that require action on the same day. You check attendance compliance alerts, late login flags, and any noticeable drop in productivity that could affect ongoing work. Idle time alerts and shift coverage gaps are some other aspects that fall under this review.
The review should not be more than ten minutes every day. It does not focus on trend analysis because a single day of data does not provide enough context. It helps you catch critical issues early and take immediate action before the workday progresses further.
2. Weekly Review
The weekly review will enable you to see the initial patterns before they become bigger problems. You look at individual and team trends in productivity, the amount of time spent during the week, attendance records, and an increase or decrease in the attrition risk score. The trends, such as a gradual decline in productivity, increased idle time for several days, or consistent overtime without recovery time, become visible at this stage.
This stage is the right point to act. It enables you to optimize work processes, redistribute workloads, or even solve inefficiencies before the problem becomes more difficult to resolve. Comparing team productivity also helps you understand whether the issue relates to a specific role or affects the entire team, which helps you decide the right action to take.
3. Monthly Review
The monthly review is about trends that are more evident in the long run. You check the overtime patterns of teams, the distribution of workload among the team members, work-life balance fluctuations, and the attrition risk score over multiple weeks. These patterns help you understand how workload and performance evolve beyond short-term fluctuations.
This stage facilitates the decision-making process in terms of capacity planning, role adjustments, and resource allocation. It also helps you evaluate whether actions taken during weekly reviews created real improvement. For a deeper understanding of how monitoring data connects to overall performance, refer to organizational health metrics.
Turn Monitoring Data into Decisions with Time Champ
Time Champ helps you convert employee monitoring data into clear, actionable decisions without confusion. You can track activity, productivity, and work patterns in one place and connect them directly to output. This gives you a complete view of how work happens, so you can identify gaps, improve workflows, and take action based on real data instead of assumptions.
With Time Champ, you go beyond analyzing data and start acting on it. You can spot performance changes early, adjust workloads, and support focused work using clear insights. This helps you improve productivity, maintain consistency, and make decisions with confidence at every level.
Conclusion
When you analyze employee monitoring data with clarity and consistency, you move beyond basic tracking and start understanding how work actually happens. Focusing on the right metrics, avoiding common misreads, and following a structured review cadence helps you identify gaps early, improve workflows, and make decisions based on real patterns instead of assumptions.
Get complete clarity on how time, effort, and output connect.
Use Time Champ to analyze employee monitoring data and make smarter decisions.

Thasleem Shaik
Table of Content
-
 What Does Employee Monitoring Data Actually Contain?
-
What Is the Right Framework for Analyzing Employee Monitoring Data?
-
What Are the Most Common Misreads of Employee Monitoring Data?
-
How Do You Build a Review Cadence That Actually Works?
-
Turn Monitoring Data into Decisions with Time Champ
-
Conclusion
Related Blogs

Performance evaluation in remote workforces: 7 metrics that matter, common biases to avoid, and how to run reviews your team trusts.
Guna Lakshmi | Apr 14, 2026
Learn how to choose the right remote employee monitoring software with the right features, scalability, and usability to manage remote teams effectively.
Guna Lakshmi | Apr 14, 2026
Change management makes employee monitoring adoption smoother. Learn strategies to reduce resistance, communicate transparently, and roll out in phases.
Anjali | Apr 15, 2026
Explore how to implement employee monitoring software effectively with clear steps, legal tips, best practices, ROI metrics, and key pitfalls to avoid.
Anjali | Apr 15, 2026
Compare employee monitoring software costs in 2026. Explore pricing factors, models, tiers, hidden fees, and the real total cost of ownership for any team.
Jahnavi Pulluri | Apr 16, 2026
Learn how to monitor employee internet usage with effective tips and tools to boost productivity, enhance security, and promote responsible online behavior.
Jahnavi Pulluri | Apr 17, 2026Ready to Manage Your Workforce Smarter?
Join our family of 1500+ companies using smart insights to redefine workforces!
Free Trial
No Credit Card Required