Organizational Health Metrics: What to Track and Why
Want to know if your team is truly productive and balanced? Explore the 9 organizational health metrics that matter and learn how to track them.

Your team may be hitting targets, meeting deadlines, and delivering results. But that doesn’t always mean everything is working well. Workloads may be uneven, some employees may be struggling to stay focused, and others may already be feeling burned out or disconnected. These issues don’t appear suddenly as they build over time.
That’s why tracking the right organizational health metrics matters. They help you understand how work is actually happening, spot problems early, and take action before they start affecting your team’s performance. Research by McKinsey & Company revealed that companies with strong organizational health achieve up to 3x higher returns to shareholders over time.
In this guide, you’ll learn what organizational health metrics are, what they tell you, and how to track and use them to keep your team productive and balanced.
Why Most Teams Track the Wrong Metrics
You don’t realize you’re tracking the wrong metrics until something starts going wrong. Over time, this creates a gap between what you track and what actually matters for your team’s performance. As a result, you may miss early signs of problems and only notice them when they start affecting results.
Key reasons teams track the wrong metrics include:
Focusing on Output and Ignoring Outcomes:
You look at how much work is done and miss what it actually leads to. Finishing tasks doesn’t always mean real progress. A team can stay busy all day and still move in the wrong direction. This usually happens when there is no clear connection between tasks and outcomes.
What you can do: Check what the work is actually improving or solving and connect tasks to clear outcomes.
Tracking What’s Easy While Missing Important Metrics
You track what’s easy to understand and miss what really matters. Tracking simple data can feel good to track, but it does not help you understand performance. This even creates a false sense of clarity.
What you can do: Choose a few metrics that clearly show progress, delays, or gaps.
Trying to Track Too Many Things:
If you track too many metrics at once, it makes everything harder to understand. Data becomes crowded and difficult to use. Over time, this makes it harder to know what actually needs your attention.
What you can do: Keep only the metrics you review regularly and actually use to make decisions.
Missing Changes in Work Behavior:
You focus on final results and miss what’s happening during the work process. Small changes in focus, habits, or engagement often appear early. These signals show up before bigger problems. These small changes are often the first signs of employee burnout.
What you can do: Pay attention to daily patterns like reduced activity, irregular timing, or changes in consistency.
You already have access to these signals in your everyday work data. You don’t need anything complex to find them. When you shift your focus from what already happened to what is happening right now, you start making better decisions. That’s what makes organizational health metrics truly useful.
Want to see how your team actually works every day?
Track key work patterns automatically and understand what drives performance with Time Champ.
9 Organizational Health Metrics That Actually Matter
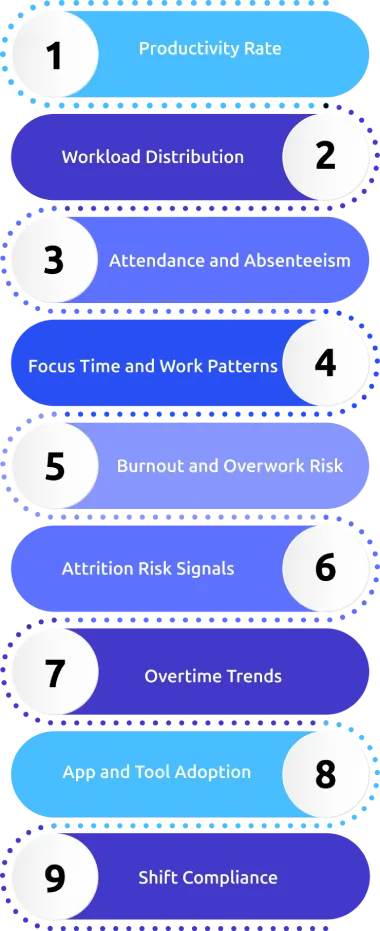
These nine metrics give you a clear and practical view of how your team is really working every day. They help you spot problems early, balance workloads, and improve productivity without guesswork.
1. Productivity Rate
Productivity rate measures how much of an employee's work time goes toward productive tasks versus idle or non-productive activities. When you track this regularly, you start to see how effectively your team uses their time. If productivity stays consistent, it usually means your team is focused and clear on their work. If it drops, it may signal distractions, unclear priorities, or a lack of direction. Over time, this metric helps you identify patterns across teams, roles, or projects and understand where improvements are needed.
2. Workload Distribution
You may assume work is evenly shared, but in reality, a few people often carry most of the load. This can lead to employee burnout for some and low engagement for others. When you track workload distribution, you can assign tasks more fairly, reduce pressure on high performers, and make better use of your entire team.
3. Attendance and Absenteeism
This helps you understand how consistently your team shows up for work and follows their assigned schedules. Attendance tells you whether employees are logging in on time, completing their shifts, and being present as expected. Absenteeism shows how often employees miss work, arrive late, or take unplanned leave. When you track both employee attendance and absenteeism together, you get a clearer picture of reliability and consistency.
4. Focus Time and Work Patterns
This metric shows how your team’s work is structured throughout the day and how much time they get for important tasks. When employees keep switching between tasks, their operational efficiency drops even if they look busy.
Tracking focus time and work patterns helps you understand how work is structured during the day and whether employees have enough space to complete important tasks without interruptions.
5. Burnout and Overwork Risk
The burnout and overwork risk metric shows whether your team is working beyond healthy and sustainable limits. When overwork starts building up, you may notice employees spending longer hours, taking fewer breaks, and finding it harder to maintain the same level of productivity. These are early warning signs of burnout.
6. Attrition Risk Signals
These are early signs that someone on your team may be losing interest or thinking about leaving. You may notice small changes like reduced activity, lower engagement, or inconsistent work patterns. When you track these signals, you give yourself the chance to act early and retain valuable team members.
7. Overtime Trends
This shows how often your team is working beyond their regular hours. Occasional overtime is normal, but if you see it happening regularly, it may point to bigger issues like heavy workloads or inefficient processes. When you track trends over time, you can understand whether overtime is temporary or something that needs to be fixed.
8. App and Tool Adoption
This metric shows whether your team is actually using the tools you have provided. If certain tools are not being used, it usually means they are not helpful, too complex, or not clearly introduced. When you identify tools that are not being used, you can remove them and reduce unnecessary costs. This helps you simplify your workflow and make better use of your budget.
9. Shift Compliance
This shows whether your team is following their assigned schedules. If team members don't follow their assigned shifts, it can affect coordination and overall performance, especially in teams working across different timings. Tracking this helps you maintain consistency, ensure proper coverage, and keep operations running smoothly.
Not sure where your team’s time is actually going?
See how work time is spent and identify areas that need improvement with Time Champ.
How Often Should You Review Organizational Health Metrics?
How often you review organizational health metrics directly affects your team. To get real value, you need to review them regularly at different levels:
Daily Check: Monitor What Needs Immediate Attention
Focus on attendance, shift compliance, real-time productivity, and late logins. These need quick action, so checking them daily helps you respond immediately.
Weekly Review: Understand Team Performance Trends
Look at the productive time for each employee, workload distribution, overtime, and any drop in activity. Weekly reviews help you spot early changes before they turn into bigger issues.
Monthly Review: Identify Patterns and Plan Improvements
Review attrition risk, burnout trends, overtime patterns across teams, attendance trends, and tool usage. Monthly insights help you understand patterns and plan long-term improvements.
When you follow this approach, you can move from reacting late to managing issues early and keeping your team on track.
How Time Champ Helps You Track Organizational Health Metrics
Using employee monitoring software like Time Champ helps you do exactly that by giving you instant insights into productivity, workload distribution, burnout risk, and attrition rate, all in one place.
Here’s how it supports you:
- Classifies apps and websites as productive, non-productive, or neutral based on roles, so you can clearly see how your team spends time.
- Gives you a clear view of workload distribution, helping you quickly identify who is overloaded and who has capacity.
- Shows focus time and work patterns, so you understand how your team’s day is structured.
- Tracks work-life balance and overtime, helping you identify burnout before it becomes serious.
- Brings all these insights into one simple dashboard, so you don’t have to rely on multiple reports.
- Tracks attendance, logins, logouts, and shift compliance automatically, and alerts you to unusual patterns like late logins or missed shifts.
When everything is visible in one place, you can understand your team better and make smarter decisions at the right time.
Want complete visibility into your team’s work without extra effort?
See how Time Champ brings all your team’s work data into one clear, organized view.
Conclusion
Organizational health metrics help you understand what’s really happening inside your team. A team can still struggle with uneven workloads, low focus, or growing burnout. What actually makes a difference is paying attention to how work happens every day. The nine organizational health metrics in this guide help you see where things are slipping and where your team needs support. When you track them regularly, you can catch issues early, balance work more effectively, and maintain a healthier work environment.

Guna Lakshmi
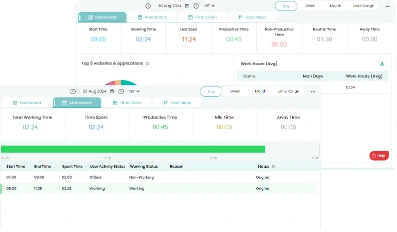
Table of Content
-
 Why Most Teams Track the Wrong Metrics
-
9 Organizational Health Metrics That Actually Matter
-
How Often Should You Review Organizational Health Metrics?
-
How Time Champ Helps You Track Organizational Health Metrics
-
Conclusion
Related Blogs
Discover 10 key workforce planning metrics for 2025. Learn how these analytics metrics impact hiring, retention, productivity & strategic HR planning.
Guna Lakshmi | September 15, 2025
Discover 20 essential employee performance metrics to track. Learn how to measure and implement these metrics to boost productivity and drive success.
Shabana Shaik | August 08, 2025
Explore the essential metrics to accurately measure and enhance your sales productivity, helping your team work smarter and achieve higher results.
Jahnavi Pulluri | Jan 11, 2025
Explore the top productivity metrics that matter for success. Gain insights to drive performance and improve organizational outcomes.
Thasleem Shaik | Nov 06, 2024
Productivity metrics are becoming a norm for businesses and organizations of all sizes, but only because it gives managers, executives, some insight
Sai Keerthi Uppala | May 30, 2023
Think about going to a workplace where people are full of energy. People look at their peers with warm smiles, people do not hesitate to share their ideas.
Thasleem Shaik | Jun 27, 2024Ready to Manage Your Workforce Smarter?
Join our family of 1500+ companies using smart insights to redefine workforces!
Free Trial
No Credit Card Required