20 Essential Workforce Planning Metrics to Track in 2026
Track the right workforce planning metrics with key KPIs, formulas, examples, and best practices to improve hiring, retention, and workforce decisions.

Planning your workforce without the right data often leads to hiring delays, skill gaps, rising labor costs, and poor resource allocation. Workforce planning metrics are measurable indicators that help you evaluate whether your workforce is aligned with your current and future business needs. It helps you measure what is working, identify areas that need attention, and make informed workforce decisions with confidence.
In this article, you'll learn the most important workforce planning KPIs to track and how each one helps you build a more efficient and future-ready workforce.
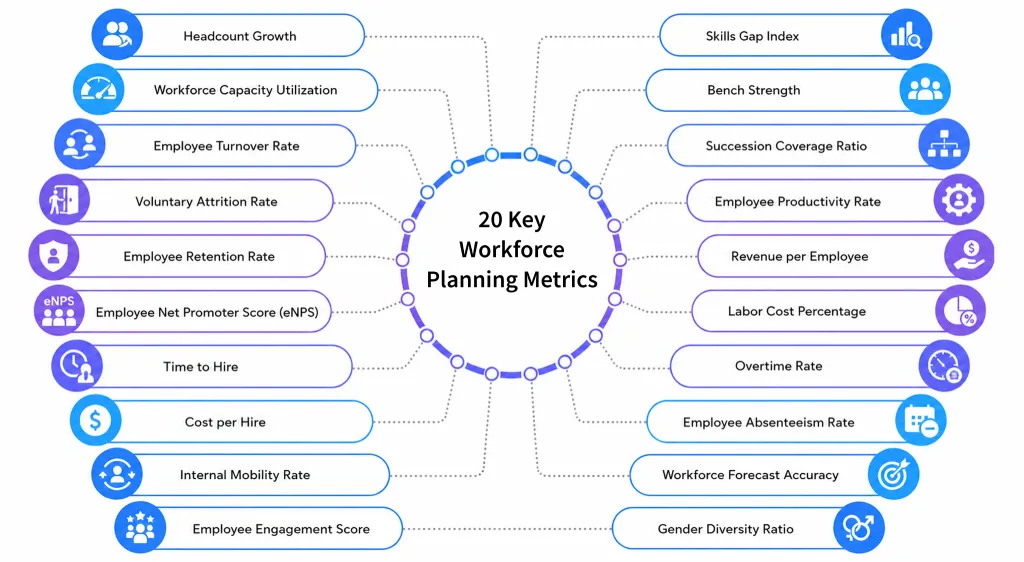
1. Headcount Growth
Headcount growth measures how your total workforce changes over a specific period. It shows whether your organization is expanding, staying stable, or reducing its workforce. Tracking this metric helps you understand whether your hiring plans match your business growth.
Formula
Headcount Growth (%) = ((Current Headcount − Previous Headcount) ÷ Previous Headcount) × 100
Example
If your organization had 450 employees last year and now has 500 employees
Headcount Growth = ((500 − 450) ÷ 450) × 100 = 11.1%
Business demand should support a steady increase in headcount. Hiring faster than business growth increases labor costs, while slow hiring creates workforce shortages.
2. Workforce Capacity Utilization
Workforce capacity utilization measures how effectively your team uses its available working hours for productive tasks. It helps you identify whether teams are underutilized or overloaded, making it easier to balance workloads and improve workforce efficiency.
Formula
Capacity Utilization (%) = (Actual Productive Hours ÷ Available Working Hours) × 100
Example
If your team worked 760 productive hours out of 900 available hours
Capacity Utilization = (760 ÷ 900) × 100 = 84.4%
Consistently low utilization may indicate excess capacity, while very high utilization over long periods can increase the risk of burnout and reduced work quality.
Pro Tip
Use our free utilization rate calculator to quickly measure team productivity and make better workforce planning decisions.
3. Employee Turnover Rate
The employee turnover rate measures the percentage of employees who leave your organization during a specific period. It is one of the most important workforce planning KPIs because it reflects workforce stability and helps you forecast future hiring needs.
Formula
Employee Turnover Rate (%) = (Number of Employees Who Left ÷ Average Number of Employees) × 100
Example
If 24 employees left during the year, and your average workforce size was 400
Employee Turnover Rate = (24 ÷ 400) × 100 = 6%
Tracking turnover by department, location, or role can help you identify patterns and address the root causes before they affect business performance.
Pro Tip
Use our free employee turnover calculator to quickly and accurately measure your turnover rate without manual calculations.
4. Voluntary Attrition Rate
The voluntary attrition rate measures the percentage of employees who choose to leave on their own through resignation or retirement. Unlike overall turnover, this metric focuses only on voluntary exits, making it useful for evaluating employee satisfaction and retention.
Formula
Voluntary Attrition Rate (%) = (Voluntary Exits ÷ Average Number of Employees) × 100
Example
If 15 employees resigned during the year, and your average workforce size was 300
Voluntary Attrition Rate = (15 ÷ 300) × 100 = 5%
A rising voluntary attrition rate may indicate issues related to career growth, compensation, workload, or workplace culture. Reviewing exit feedback alongside this metric helps you identify improvement opportunities.
Pro Tip
Want to quickly understand how many employees are leaving your organization? Use our free attrition rate calculator to get accurate insights in seconds and make better workforce decisions.
5. Employee Retention Rate
The employee retention rate measures the percentage of employees who remain with your organization over a specific period. A high retention rate usually indicates workforce stability, stronger engagement, and lower hiring costs.
Formula
Employee Retention Rate (%) = (Employees Remaining at the End of the Period ÷ Employees at the Start of the Period) × 100
Example
If your organization started the year with 250 employees and 235 remained at the end of the year
Employee Retention Rate = (235 ÷ 250) × 100 = 94%
Retention becomes even more valuable when combined with turnover and attrition metrics because together they provide a clearer picture of your workforce health and long-term planning needs.
Pro Tip
Our free employee retention rate calculator helps you quickly measure your employee retention rate and clearly understand how well your organization is retaining talent in a simple and easy way.
6. Employee Net Promoter Score (eNPS)
Employee Net Promoter Score (eNPS) measures how likely employees are to recommend your organization as a place to work. It is a simple but powerful way to understand employee satisfaction, engagement, and overall workplace experience.
Formula
eNPS = % of Promoters − % of Detractors
Employees are usually asked one question: "On a scale of 0 to 10, how likely are you to recommend this company as a place to work?"
- Promoters (score 9–10)
- Passives (score 7–8)
- Detractors (score 0–6)
Example
If 60% of employees are promoters and 20% are detractors
eNPS = 60 − 20 = 40
A positive eNPS indicates that more employees are satisfied and willing to recommend the organization, while a negative score suggests potential issues with employee experience.
Don't let workforce gaps slow your business growth anymore.
Try Time Champ to identify gaps and plan your workforce confidently.
7. Time to Hire
Time to hire measures how quickly you move a candidate through the recruitment process after they apply until they accept the job offer. Unlike time to fill, it focuses only on the candidate journey. Tracking this metric supports dynamic workforce planning by helping you respond faster to changing workforce demands.
Formula
Time to Hire = Total Number of Days from Application to Offer Acceptance ÷ Number of Hires
Example
If five candidates took a total of 75 days from application to accepting offers
Time to Hire = 75 ÷ 5 = 15 days
A shorter hiring process improves the candidate experience and reduces the risk of losing qualified talent to competitors.
8. Cost per Hire
Cost per hire measures the average amount spent to recruit and onboard a new employee. It includes expenses such as job advertising, recruiter fees, assessment tools, interview costs, onboarding, and recruitment software. Monitoring this metric helps you control hiring costs without compromising hiring quality.
Formula
Cost per Hire = Total Recruitment Costs ÷ Total Number of Hires
Example
If your organization spent $40,000 on recruitment and hired 20 employees
Cost per Hire = 40,000 ÷ 20 = $2,000
Comparing cost per hire with quality of hire provides a better picture of recruitment effectiveness than looking at hiring costs alone
9. Internal Mobility Rate
The internal mobility rate measures the percentage of employees who move into new roles, receive promotions, or transfer to different departments within your organization. A high internal mobility rate shows that you are developing existing talent instead of relying only on external hiring. Many organizations also use a workforce planning template to monitor internal movement alongside hiring and succession planning activities.
Formula
Internal Mobility Rate (%) = (Number of Internal Role Changes ÷ Average Number of Employees) × 100
Example
If 18 employees changed roles internally during the year, and your average workforce size was 300
Internal Mobility Rate = (18 ÷ 300) × 100 = 6%
When you actively support internal mobility, you can make better use of your existing talent, lower hiring costs, and create clear growth opportunities for your employees.
10. Employee Engagement Score
The employee engagement score measures how committed, motivated, and satisfied employees are with their work and the organization. It is usually collected through surveys that assess factors such as job satisfaction, workplace culture, leadership support, and growth opportunities.
Formula
Employee Engagement Score (%) = (Total Engagement Survey Score ÷ Maximum Possible Score) × 100
Example
If 100 employees rate their engagement on a scale of 1 to 5 and the total score is 420, the average engagement score is 420 ÷ 100 = 4.2, which indicates a high level of engagement across the organization.

Did You Know
According to Gallup, highly engaged teams show 23% greater profitability compared to less engaged teams.
11. Skills Gap Index
The skills gap index measures the difference between the skills your workforce currently has and the skills needed to achieve your business goals. Tracking this metric helps you identify skill shortages early, prioritize training, and make better hiring decisions before gaps begin affecting business performance.
Formula
Skills Gap Index (%) = (Required Skills − Available Skills) ÷ Required Skills × 100
Example
If your organization requires 500 critical skills across different roles but currently has only 430
Skills Gap Index = ((500 − 430) ÷ 500) × 100 = 14%
A lower skills gap index indicates your workforce is better prepared to meet current and future business demands. Reviewing this metric regularly helps you improve workforce readiness through targeted hiring and employee development.
12. Bench Strength
Bench strength measures how prepared your organization is to fill critical roles using internal talent. It reflects the strength of your leadership and talent pipeline and shows whether qualified successors are available when key positions become vacant.
Formula
Bench Strength (%) = (Employees Ready for Critical Roles ÷ Total Critical Roles) × 100
Example
If your organization has 25 critical positions and 20 qualified internal successors
Bench Strength = (20 ÷ 25) × 100 = 80%
A strong bench strength reduces hiring risks, supports business continuity, and shortens the time needed to fill leadership positions. Many organizations aim to have multiple ready successors for every business-critical role.
Poor workforce visibility often leads to costly planning mistakes.
Use Time Champ to gain real-time workforce insights instantly.
13. Succession Coverage Ratio
The succession coverage ratio measures the percentage of critical roles that have at least one identified successor. It helps you understand how prepared your organization is for leadership transitions and unexpected workforce changes.
Formula
Succession Coverage Ratio (%) = (Critical Roles with Identified Successors ÷ Total Critical Roles) × 100
Example
If your organization has 40 critical positions and successors have been identified for 34 of them
Succession Coverage Ratio = (34 ÷ 40) × 100 = 85%
A higher succession coverage ratio means your organization is better equipped to maintain business continuity without disruptions caused by unexpected departures.
14. Employee Productivity Rate
The employee productivity rate measures how efficiently your workforce converts time and effort into business output. The exact measurement varies by industry and can include units produced, projects completed, sales generated, or services delivered. Tracking productivity helps you understand whether your workforce is operating efficiently and where improvements are needed.
Formula
Employee Productivity Rate = Total Output ÷ Total Employees
Example
If your organization completed 2,400 customer support tickets in a month with 40 support employees
Employee Productivity Rate = 2,400 ÷ 40 = 60 tickets per employee
Reviewing productivity alongside utilization and engagement provides a more complete picture of workforce performance instead of relying on a single metric.
Did You Know
Organizations that rank among the highest performers in employee experience consistently achieve stronger business outcomes. They deliver more than twice the level of innovation (51 percent compared to 24 percent) and more than double the customer satisfaction (32 percent compared to 14 percent). They also achieve 25 percent higher profits compared to organizations with lower employee experience scores.
15. Revenue per Employee
Revenue per employee measures the average revenue generated by each employee during a specific period. It helps you evaluate workforce efficiency and understand how effectively your workforce contributes to business growth.
Formula
Revenue per Employee = Total Revenue ÷ Average Number of Employees
Example
If your organization generated $12 million in annual revenue with an average workforce of 300 employees
Revenue per Employee = $12,000,000 ÷ 300 = $40,000
This metric becomes more meaningful when you compare it with labor costs, productivity, and headcount growth.
16. Labor Cost Percentage
Labor cost percentage measures how much of your total revenue is spent on employee compensation, including salaries, wages, benefits, payroll taxes, and overtime. It helps you understand whether workforce costs are aligned with overall performance and supports better budgeting decisions.
Formula
Labor Cost Percentage = (Total Labor Costs ÷ Total Revenue) × 100
Example
If your annual labor costs are $2 million and your total revenue is $10 million
Labor Cost Percentage = (2,000,000 ÷ 10,000,000) × 100 = 20%
Tracking this metric alongside revenue per employee gives you a clearer view of workforce efficiency. A rising labor cost percentage without corresponding business growth may indicate the need to review staffing levels or workforce allocation.
17. Overtime Rate
The overtime rate measures how much overtime your workforce works compared to regular working hours. It helps you identify workload imbalances, staffing shortages, and scheduling issues before they increase labor costs or affect employee well-being.
Formula
Overtime Rate (%) = (Total Overtime Hours ÷ Total Regular Hours Worked) × 100
Example
If your workforce completed 180 overtime hours and 3,600 regular working hours
Overtime Rate = (180 ÷ 3,600) × 100 = 5%
Organizations expect occasional overtime during busy periods. However, consistently high overtime often indicates that your workforce needs additional support or better workload distribution.
Pro Tip
Use our free overtime calculator to quickly track extra hours and keep your workforce planning accurate and simple.
18. Employee Absenteeism Rate
The employee absenteeism rate measures how often employees are absent from work during a specific period, excluding approved vacations. Tracking this metric helps you identify attendance patterns that may affect productivity, service quality, and workforce planning.
Formula
Employee Absenteeism Rate (%) = (Total Absent Days ÷ Total Available Workdays) × 100
Example
If your workforce recorded 90 absent days during a month with 2,250 available workdays
Employee Absenteeism Rate = (90 ÷ 2,250) × 100 = 4%
When absenteeism starts increasing, reviewing attendance trends by team, location, or season can help you identify underlying issues and take corrective action early.
Pro Tip
Track absenteeism regularly using our free absence percentage calculator so you can quickly spot patterns and address issues before they impact productivity.
19. Workforce Forecast Accuracy
Workforce forecast accuracy measures how closely your workforce forecasts match actual staffing requirements. It shows whether your hiring plans, staffing levels, and workforce projections are accurate enough to support business demand without overstaffing or understaffing.
Formula
Forecast Accuracy (%) = (1 − |Forecasted Workforce − Actual Workforce| ÷ Actual Workforce) × 100
Example
If you forecasted a workforce requirement of 520 employees but actually needed 500
Forecast Accuracy (%) = (1 − (|520 − 500| ÷ 500)) × 100 = 96%
A high forecast accuracy helps you reduce hiring costs, avoid workforce shortages, and improve long-term workforce planning. Reviewing this metric regularly also helps you refine future workforce forecasts and make better strategic decisions.
20. Gender Diversity Ratio
The gender diversity ratio measures the percentage of employees from different genders in your workforce. It helps you understand how balanced your organization is and whether your hiring and retention practices support diversity and inclusion goals.
Formula
Gender Diversity Ratio (%) = (Number of Employees of a Specific Gender ÷ Total Employees) × 100
Example
If your organization has 200 employees, with 120 men and 80 women
Female Diversity Ratio = (80 ÷ 200) × 100 = 40% Male Diversity Ratio = (120 ÷ 200) × 100 = 60%
How Does Time Champ Help You Track Workforce Planning Metrics?
Tracking workforce planning metrics manually often leads to incomplete data, delayed reports, and decisions based on assumptions. Time Champ brings all your workforce data into one platform, making it easier to monitor workforce performance, identify trends, and plan ahead with confidence.
Instead of spending hours collecting information from multiple systems, you get real-time insights that help you make faster and more informed workforce decisions. Learn how Time Champ can help improve workforce planning:
- Automatic Time Tracking: Capture work hours automatically without manual timesheets, giving you accurate data for workforce planning and resource allocation.
- Workforce Analytics Dashboard: View workforce productivity, utilization, attendance, and workforce trends in one place through real-time dashboards that support better planning decisions.
- Productivity Tracking: Measure productive time, idle time, and work patterns to understand how efficiently your workforce spends time and where improvements are needed.
- Workload Forecasting: Predict future workload based on past data and current trends, helping you plan staffing needs in advance.
- Custom Reports and Dashboards: Generate workforce reports such as productivity reports, attrition risk reports, and activity reports based on the metrics that matter most to your organization without spending time on manual reporting.
- Real-Time Workforce Insights: Access live workforce data to identify trends early, respond to changing business needs, and make better workforce planning decisions.
With the right workforce insights available in one place, planning becomes more accurate and far less time-consuming. Time Champ helps you move beyond spreadsheets and static reports by giving you the visibility needed to track workforce planning metrics, improve workforce performance, and build a workforce strategy based on real data instead of guesswork.
Struggling to track workforce planning metrics across multiple systems?
Try Time Champ to manage every metric from one place.
Conclusion
Tracking the right workforce planning metrics helps you understand your workforce, identify gaps early, and make better decisions with confidence. When you regularly review these metrics, you can improve hiring, workforce utilization, retention, productivity, and long-term planning while keeping your workforce aligned with business goals.
If you want to simplify the process, Time Champ gives you the visibility you need to track workforce data in one place with real-time reports and actionable insights. With accurate data available, you can spend less time gathering information and more time building a stronger workforce strategy.

Thasleem Shaik

Table of Content
 1. Headcount Growth
- 2. Workforce Capacity Utilization
- 3. Employee Turnover Rate
- 4. Voluntary Attrition Rate
- 5. Employee Retention Rate
- 6. Employee Net Promoter Score (eNPS)
- 7. Time to Hire
- 8. Cost per Hire
- 9. Internal Mobility Rate
- 10. Employee Engagement Score
- 11. Skills Gap Index
- 12. Bench Strength
- 13. Succession Coverage Ratio
- 14. Employee Productivity Rate
- 15. Revenue per Employee
- 16. Labor Cost Percentage
- 17. Overtime Rate
- 18. Employee Absenteeism Rate
- 19. Workforce Forecast Accuracy
- 20. Gender Diversity Ratio
- How Does Time Champ Help You Track Workforce Planning Metrics?
- Conclusion
Related Blogs

Learn why workforce analytics is essential for process reinvention, how it reinvents key business processes, best practices & how to measure success.
Anjali | Apr 02, 2026
Learn what AI in the workforce is, why it matters, and how to manage it effectively. Also, explore its pros and cons to strengthen productivity and performance.
Shabana Shaik | Feb 11, 2026
Get the complete guide on contingent workforce management: strategies, benefits, challenges, and how to optimise cost & performance with the right system.
Chethana Choudary | September 01, 2025
Explore the 10 workforce management reports to master your business. They unlock key insights to boost productivity, cut costs & drive business growth.
Chethana Choudary | Oct 01, 2025
Discover 10 workforce planning models every HR professional should know to align talent with business goals, improve efficiency, and plan for the future.
Thasleem Shaik | September 30, 2025
Stay ahead with 10 workforce management trends that are redefining business success. From digital tools to staff growth, see what’s driving the future of work.
Guna Lakshmi | September 25, 2025


 4.7/5 avg.
Ready to Manage Your Workforce Smarter?
Join our family of 1500+ companies using smart insights to redefine workforces!

Free Trial
No Credit Card Required