How to Use Workforce Productivity Analytics Effectively
Workforce productivity analytics turns daily work data into clear decisions. Learn the key metrics, monitoring signals, and AI tools that improve team output.

Workforce productivity analytics helps you understand why output falls short even when work looks active. Your team logs full days, meetings happen, and tasks move forward, but results still do not match expectations. You check attendance reports and everything looks fine. You review the project tracker and deadlines technically stay on track. But something is clearly off, and you cannot point to exactly what. Sustainable OKR framework for productivity depends on clear feedback loops, not just clearer dashboards.
That gap between "looks productive" and "actually productive" is where most performance problems live, and workforce productivity analytics closes that gap. Workforce productivity analytics shows active time versus idle time, which applications your team actually uses, and how productivity scores change over time. This guide covers what workforce productivity analytics is, the core metrics that give you a clear view of work patterns, and how to use those insights to identify issues early and improve workforce productivity.
What Is Workforce Productivity Analytics?
Workforce productivity analytics is the process of collecting, measuring, and interpreting data on employee performance, efficiency, and engagement. It helps you understand how work gets done, identify barriers, and uncover opportunities to optimize output across teams and departments.
Workforce productivity analytics goes beyond simple time tracking. It provides a deeper view into how employees use their time, collaborate, and contribute to business goals. By analyzing these patterns, you can make data-driven decisions that remove inefficiencies and improve overall performance.
This approach helps you align resources with priorities, spot productivity trends early, and support employees with the right guidance. Instead of guessing what slows progress, you can clearly see what is holding work back and take the right steps to improve it, leading to better engagement and consistent results.
Why Workforce Productivity Analytics Matters?
Employees stay productive for only about 60% of their workday, which means a significant portion of time goes into low-value or unfocused activity. This clearly shows why workforce productivity analytics plays a critical role in improving performance. Here are the key ways it helps you manage and optimize workforce productivity:
1. Turns Assumptions into Clear Signals
With workforce productivity analytics, you gain a clear view of performance patterns and outcomes. You can identify what is working, where gaps exist, and adjust processes or support accordingly. Instead of relying on assumptions, you make decisions based on accurate insights that help improve results.
2. Identifies Bottlenecks Before They Affect Output
Productivity data helps you detect process issues early. When active time drops after you implement a new workflow, or when a key application shows consistently low usage, these patterns indicate bottlenecks before they impact deadlines. Real-time alerts for productivity drops help you identify the cause and fix the issue before it affects work outcomes.
3. Detects Burnout Risk Before It Becomes Attrition
Workforce productivity analytics helps you spot early burnout signs through changes in work patterns. When work hours increase but output drops, it signals growing pressure. These patterns support attrition prediction, helping you identify risk early and take action before it affects performance.
4. Optimizes Resources
Productivity analytics helps you align work with business priorities. You can allocate time, skills, and budgets where they create the most impact, reducing waste, improving efficiency, and delivering better results.
5. Tracks Performance Fairly
Workforce analytics metrics give you a clear and objective way to measure contributions. You can use actual performance data to decide rewards, promotions, and recognition. This also helps you set clear expectations, making reviews more transparent and motivating.
Get clear visibility into how your team actually works and where productivity drops.
Use Time Champ to turn daily work data into meaningful decisions that improve workforce productivity.
Monitoring-Specific Metrics That Drive Productivity Decisions
To understand how work actually happens, you need more than high-level reports. Workforce analytics metrics based on daily activity give you a clear view of where time goes, how work flows, and where performance starts to drop. The following metrics help you make informed decisions:
- Active Time Percentage: Shows how much of the workday goes into productive tasks. Active time data reveals whether hours spent actually contribute to output.
- App and Website Usage: Tracks how much time goes into different tools and platforms. Usage reports reveal useful tools, distractions, and gaps in adoption.
- Idle Time Rate: Measures periods with no activity during work hours. High idle rates highlight disengagement, unclear tasks, or process delays.
- Productivity Score: Combines multiple factors like active time and usage patterns into a single value. It gives you a quick way to compare performance across individuals and teams.
- Work-Life Balance Signal: Shows how work hours extend beyond expected schedules. It helps you identify overload and take steps to maintain consistent performance.
- Team vs Individual Comparison: Compares performance across team members. It helps you identify workload imbalances and areas where support or adjustments are needed.
- Trend Direction: Tracks how productivity changes over time. It helps you identify improvement or decline early and take action before it affects results.
Key Metrics to Track in Workforce Productivity Analytics
To improve performance, you need to track the right data points that reflect how work actually happens. The following metrics give you a clear view of time usage, work patterns, and overall productivity, helping you make better decisions and improve outcomes.
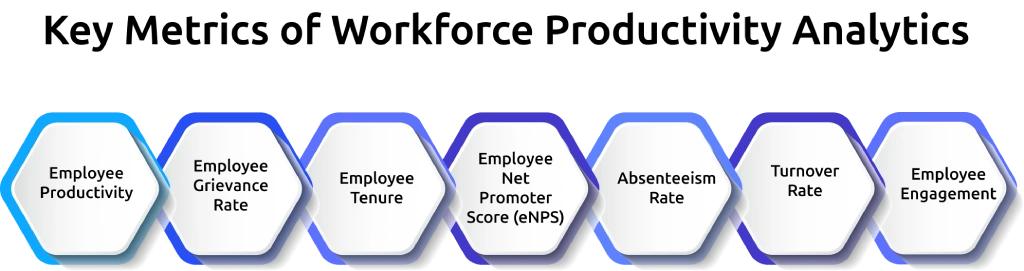
1. Employee Productivity
Employee productivity is a measure of how effectively employees complete work or achieve performance standards. It shows if employees are delivering the expected results within the given time.
Formula:
Employee productivity = Output (units produced or services completed) ÷ Total hours worked
Higher productivity indicates effective use of time and skills, and lower productivity figures point to the need for training, gaps in the process, or workload challenges.
2. Employee Grievance Rate
This metric reflects the number of formal complaints raised by employees, often about workplace conditions, management practices, or organizational policies.
Formula:
Employee grievance rate = (Total grievances ÷ Total number of employees) × 100
Employee grievance rate may point to cultural or managerial issues. Monitoring this metric lets you act early on satisfaction issues and reduce risks of disengagement or turnover.
3. Employee Tenure
Employee tenure measures the average number of years that employees remain with the company. It gives an insight into employee retention, loyalty, and stability.
Formula:
Employee tenure = Total years of service for all employees ÷ Total number of employees
Longer tenure usually reflects strong engagement and a positive environment. Shorter spans may highlight mismatched roles, limited growth opportunities, or unsatisfactory conditions.
4. Employee Net Promoter Score (eNPS)
Employee Net Promoter Score (eNPS) measures how satisfied and loyal employees are to their workplace. It is based on a single question, which is how likely they are to recommend the company as a place to work.
Formula:
eNPS = % of promoters – % of detractors
A high eNPS establishes a positive culture and commitment, whereas a low score means dissatisfaction and turnover. Regular tracking helps businesses to see how employees generally feel about their workplace and highlight potential areas for improvement.
5. Absenteeism Rate
This metric tracks the percentage of days employees miss work without prior approval, such as unexpected sick leave or unplanned absences.
Formula:
Absenteeism rate = (Number of unplanned absent days ÷ Total scheduled workdays) × 100
Frequent absenteeism disrupts operations and reduces team effectiveness. Identifying patterns reveals problems such as burnout, disengagement, or role-specific challenges. This helps you create more effective support policies.
6. Turnover Rate
Turnover rate measures how often employees leave an organization during a specific period, whether voluntarily or involuntarily.
Formula:
Turnover rate = (Number of separations during the period ÷ Average number of employees) × 100
A high turnover may raise the cost of recruitment and training, damage morale, and reduce growth. Tracking employee turnover assists you in uncovering trends, realigning retention policies, and enhancing workforce stability.
7. Employee Engagement
Employee engagement is an indication of the level of commitment and motivation that individuals have in their roles. It can be measured through surveys, interviews, and performance feedback.
Engaged employees tend to perform better, remain loyal, and contribute positively to your business goals. Engagement tracking helps to point out areas that require focus, which include leadership style, work environment, or career development.
What Are the Benefits of Workforce Productivity Analytics?
When you see real patterns behind daily output, improving results becomes straightforward and removes inefficiencies. The following benefits show how you can strengthen performance and gain clearer visibility through productivity insights.

1. Improves Decision-Making
Having reliable productivity data enables you to make informed choices instead of relying on guesswork. With a clear understanding of trends and performance, you can spot potential challenges in advance and apply those strategies that align with long-term goals.
2. Increases Efficiency
Workforce productivity analytics uncovers areas where processes slow down, time wastage, or misalignment of tasks. Fixing these gaps enables you to simplify processes, reduce unnecessary work, and produce greater results with fewer resources.
3. Enhances Employee Engagement
Understanding what discourages employees helps you build better work environments. Insights from productivity analytics can provide enough information to build initiatives such as recognition, flexible work policies, and growth opportunities that keep employees motivated.
4. Smarter Resource Allocation
Workforce analytics shows how you use skills, time, and budgets across your team. This helps you move resources to where they are needed most, so you complete work efficiently without wasting time or money.
5. Better Retention
By analyzing data on turnover, tenure, and satisfaction, you can spot early warning signs of disengagement. Taking timely action can enhance staff experiences, reduce hiring costs, and retain good talent.
See which workflows slow your team down and fix them before deadlines slip.
Use Time Champ to take action early and keep work moving efficiently.
Is Workforce Productivity Analytics and Workforce Productivity the Same?
Workforce productivity analytics and workforce productivity are not the same. Workforce productivity focuses on the actual output employees deliver, while workforce productivity analytics examine the data behind that output to uncover trends, patterns, and areas for improvement. In simple terms, productivity shows the actual results, while analytics describes the "why" and "how" behind the results.
| Aspect | Workforce Productivity | Workforce Productivity Analytics |
|---|---|---|
| Meaning | The measure of how much work employees complete within a given time frame. | The use of data and metrics to study productivity levels and identify factors influencing performance. |
| Focus | Direct output, efficiency, and results achieved. | Trends, patterns, and insights that explain the reasons behind productivity levels. |
| Purpose | To understand whether employees are meeting targets and expectations. | To optimize workflows, reduce bottlenecks, and enhance long-term efficiency. |
| Approach | Outcome-based, looks only at results delivered. | Data-driven, examines the processes, behaviors, and resources driving results. |
| Usefulness | Provides a snapshot of current performance. | Offers actionable strategies for improvement and growth. |
| Example | A sales team closes 200 deals in a month. | Analytics shows which sales strategies were effective, which didn’t work, and how to repeat successful approaches. |
How Can AI Improve Workforce Productivity Analytics?
AI strengthens workforce productivity analytics by turning large volumes of work data into clear, usable insights. Instead of manually reviewing reports, AI automatically identifies patterns such as drops in productivity, unusual work behavior, or shifts in time usage. It highlights what needs attention and helps you understand performance changes faster. As AI adoption grows, around 88% of organizations already use it in at least one business function, showing how widely it supports data-driven operations.
AI also adds predictive capability to productivity analysis. Instead of only showing current performance, it uses historical work data to build patterns and indicate where performance is heading. In workforce analytics, this helps identify attrition risks, burnout signals, and workload imbalances early, before they affect outcomes. The value comes from receiving the right signals at the right time, so you can take timely and informed action.
Analyze Your Workforce Productivity Easily with Time Champ
Time Champ is an employee monitoring software that pairs activity tracking with workforce intelligence analytics, automatically tracking how your team spends work time across every device. It captures active time, idle time, app and website usage, and productivity scores from real work sessions, so you can get a clear picture of where hours go without waiting for weekly reports or manual updates.
The platform classifies every application as productive, non-productive, or neutral based on each employee's role, so the productivity score reflects actual work quality rather than time spent on screen. Team dashboards let you compare individual and team performance, while trend reports show how productivity changes over time. Alerts highlight drops as they happen, so you can quickly understand the issue and take action before it affects overall performance.
Conclusion
Workforce productivity analytics helps you move beyond basic tracking and understand how work actually happens. When you use the right metrics and insights, you can identify gaps early, improve focus, and keep performance consistent across your team. The value lies in how you act on the data, making timely adjustments that strengthen results and support better day-to-day execution.
Gain clarity into time usage across your team.
Use Time Champ to reduce inefficiencies and improve performance.

Thasleem Shaik
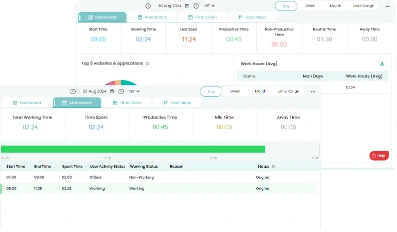
Table of Content
-
 What Is Workforce Productivity Analytics?
-
Why Workforce Productivity Analytics Matters?
-
Monitoring-Specific Metrics That Drive Productivity Decisions
-
Key Metrics to Track in Workforce Productivity Analytics
-
What Are the Benefits of Workforce Productivity Analytics?
-
Is Workforce Productivity Analytics and Workforce Productivity the Same?
-
How Can AI Improve Workforce Productivity Analytics?
-
Analyze Your Workforce Productivity Easily with Time Champ
-
Conclusion
Related Blogs

Workforce Forecasting explained: A step-by-step guide covering importance, models, tools, and implementation to help HR leaders plan smarter for the future.
Thasleem Shaik | September 01, 2025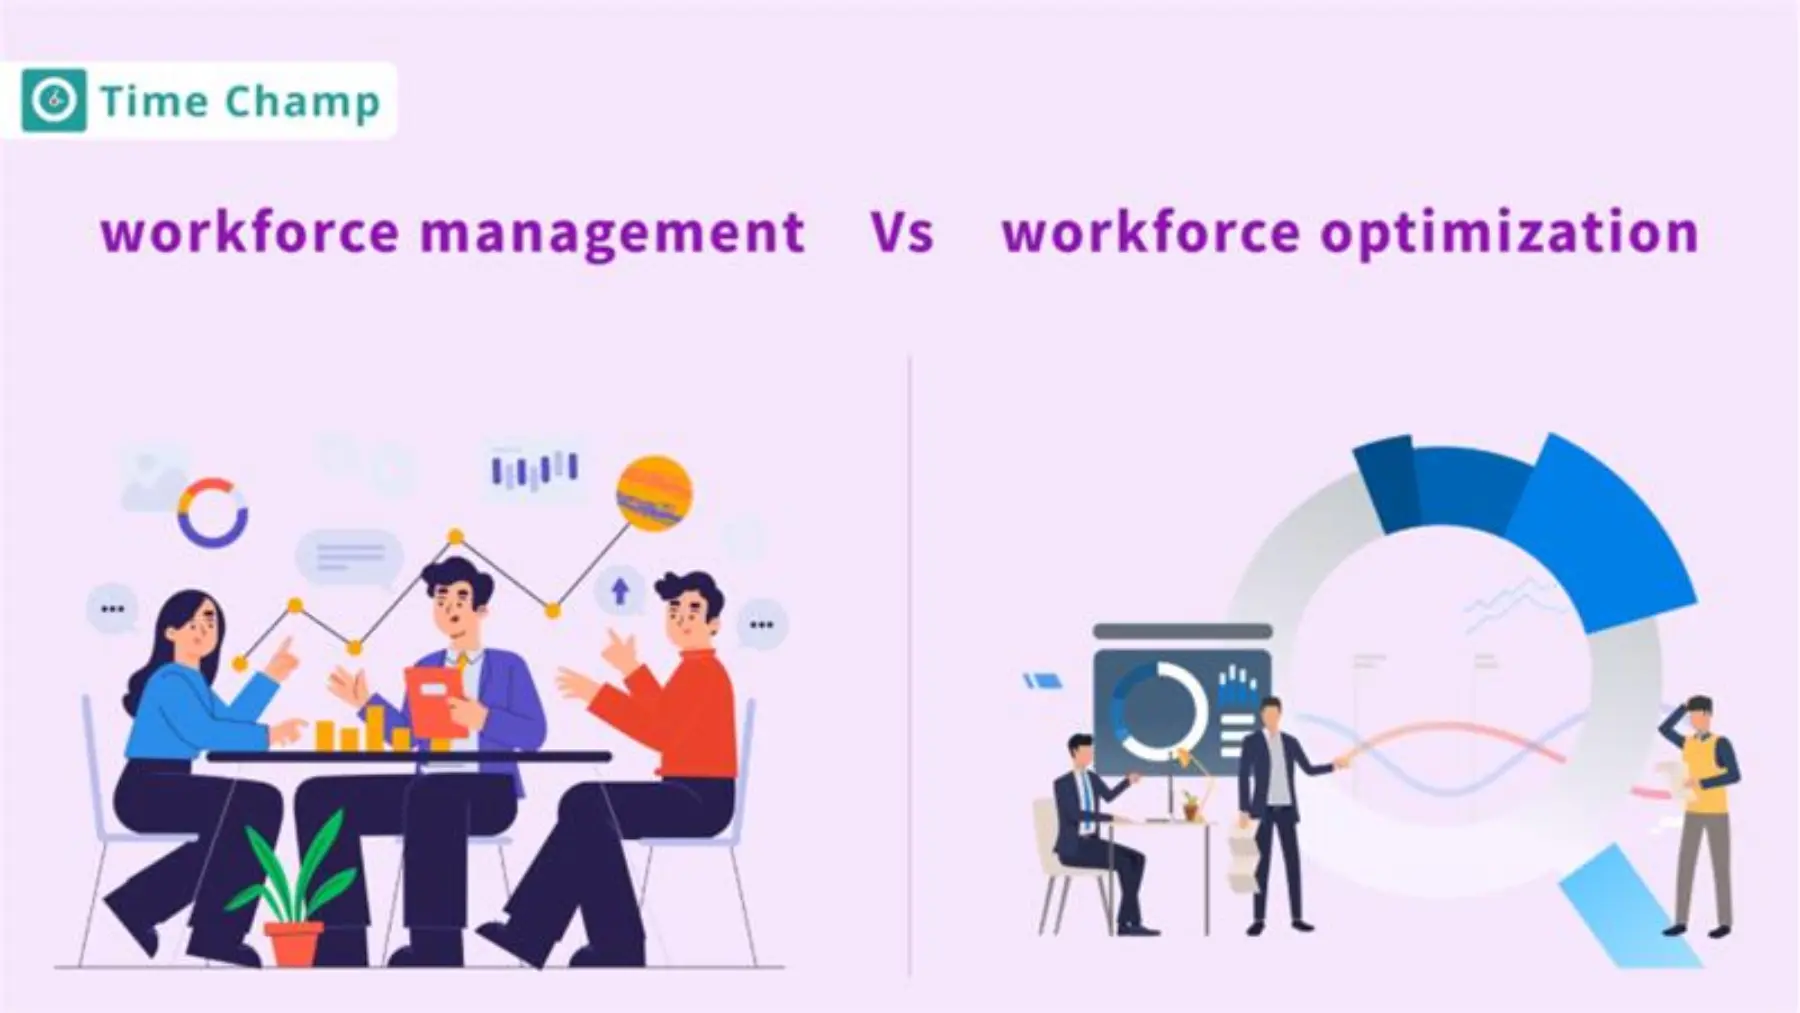
Workforce Management (WFM) vs Workforce Optimization (WFO). Learn the definitions, key functions, similarities, and best-fit use cases for businesses
Chethana Choudary | September 01, 2025
Discover how field service workforce management improves scheduling, boosts team productivity, lowers operational costs, and enhances customer satisfaction.
Jahnavi Pulluri | August 22, 2025
Intraday management helps boost workforce efficiency. Learn key steps, strategies, and best practices to optimize real-time operations for better results.
Thasleem Shaik | September 01, 2025
Discover workforce development: definition, strategies, and examples. Learn how to create effective programs, boost skills, and achieve business goals.
Guna Lakshmi | September 01, 2025
Explore the 10 workforce management reports to master your business. They unlock key insights to boost productivity, cut costs & drive business growth.
Chethana Choudary | September 30, 2025Ready to Manage Your Workforce Smarter?
Join our family of 1500+ companies using smart insights to redefine workforces!
Free Trial
No Credit Card Required