What Is a Productivity Report? A Manager's Complete Guide
A productivity report shows how work really happened. Learn the metrics, types and formats to include, how to build one, and how to read it the right way.

An effective productivity report saves you from an almost embarrassing situation:
You randomly sit down to open the previous week’s productivity report and spot a name that’s at the bottom of the list, and your first instinct is to fire off a "hey, can we chat?" message.
But little did you know that person shipped the biggest deliverable of the week and spent two days in deep, screen-light strategy work that the report quietly logged as "low activity."
That tiny moment is the whole problem with productivity reports, and it really harms employee morale.
These reports are genuinely useful, but only when you know what you are looking at. A report can make a star look like a slacker and a busy procrastinator look like a hero. So, in this guide, I will keep it practical: what a productivity report actually is, what to put in it, the formats and types you will run into, how to build one, and the part most guides skip entirely, how to read it without jumping to the wrong conclusion.
What is a Productivity Report?
A productivity report is a document that summarizes how work happened over a set period. It pulls together metrics like tasks completed, time spent, and goals met, then turns that raw activity into a clear picture of output, efficiency, and where things are slipping, so you can make strong decisions instead of just sitting and guessing in an infinite loop.
Think of it as the difference between feeling like your team had a rough week and actually knowing why. Without a report, you manage on vibes and the loudest voice in the standup. With one, you can see patterns: which projects eat the most time, when focus peaks, where work piles up. The keyword is picture. A good productivity report is not a scoreboard for catching people out. It is a map for spotting what to fix.
What Key Metrics Belong in a Productivity Report?
The metrics that matter most are tasks completed, time spent on tasks, goals achieved, deadlines met, efficiency rate, focus and break patterns, and interruptions. The trick is to balance: pair output metrics (what got done) with context metrics (how and at what cost), so the report shows real productivity, not just how busy everyone is.
You do not need every metric on this list, though, just pick the handful that answers your actual question. To make that easier, here they are grouped by what they tell you.
| Group | Metric | What it Really Tells You |
|---|---|---|
| Output | Tasks completed, goals achieved, deadlines met | Whether the work that mattered actually got finished, not just started |
| Time | Time spent on tasks, efficiency rate | Where hours go and how well they convert into results |
| Focus | Focus time, interruptions, context switches | How protected deep work is, and what keeps breaking it |
| Wellbeing | Breaks, downtime, workload balance | Early warning signs of burnout or an unfair load |
That last group is the one people often forget. Skipping breaks looks very productive on paper, but takes a heavy toll on the employee’s mental health, and interruptions matter more than they seem. Research from the University of California, Irvine, found it takes around 23 minutes to fully refocus after a single interruption, so a day full of pings is definitely not a small thing, it is a hidden tax on every other metric in the report.
What are the Main Types of Productivity Reports?
The most common types are daily, weekly, and monthly reports (split by time frame), plus project, team, individual, and sales reports (split by focus).
- Daily reports catch problems fast
- Monthly reports reveal trends
- Team or project reports show how groups and initiatives are really tracking against their goals.
Most teams use two or three of these together: a quick daily or weekly pulse, a monthly trend view, and a project or team report when something specific needs attention. Here is how to tell them apart.
| Report Type | Best For | Watch Out For |
|---|---|---|
| Daily / weekly | Spotting issues early and keeping short-term work on track | Over-checking. Daily numbers are noisy, do not overreact to one day |
| Monthly | Seeing real trends, cycles, and progress on long-term goals | Acting too late if it is your only report |
| Project-specific | Tracking milestones, timelines, and resource use on one initiative | Missing the people behind the project |
| Team | Comparing workloads and spotting collaboration bottlenecks | Turning it into a leaderboard that pits people against each other |
| Individual | Coaching, reviews, and recognizing strong performers | Reading one person's numbers without context |
If you want to go deeper on the broader idea of measuring different types of employee productivity, we cover that separately, and for reports, the rule of thumb is simple: let the decision pick the report.
Work out what you need to decide first, then pull the one report that answers it, instead of running everything and hoping a pattern jumps out of your imagination.
What Does a Productivity Report Format Look Like?
Most reports fail because they stop at the data and never explain it. A good format forces you to say what the numbers mean, so here is the structure I would use:
- Header: Name or team, the period covered, and the report's purpose in a single line.
- Summary: Three to five headline numbers up top, so a busy reader gets the gist in ten seconds.
- Data: The detail, in tables or simple charts. Easy to scan, not a wall of figures.
- Analysis: What the data actually says. Patterns, surprises, and the "so what."
- Next Steps: Two or three concrete actions. This is the point of the whole thing.
Here’s a tiny example of a summary line: "This week the team completed 84% of planned tasks (up from 71%), but focus time dropped 20% on meeting-heavy Wednesdays."
See how that single sentence has a number, a comparison, and a clue about what to fix. That’s how you know your format actually works.
How to Create a Productivity Report? (6 steps)
To create a productivity report, you need to keep it focused, don’t include anything and everything that comes to your mind, keep it precise because a short report people read and act on beats a detailed one nobody even opens.
The old way of doing this used to take eight steps, and honestly, six are more than enough. Here’s a better and newer version:
- Define the Purpose: Decide the one question the report should answer, like "is the launch team overloaded?" A report without a question becomes paperwork.
- Pick Your Metrics: Choose three to five metrics that map to that question. Resist the urge to measure everything.
- Gather the Data: Pull data from reliable sources: time logs, project tools, or automated tracking. You put garbage in, and get a garbage report.
- Organize it: Use the five-part format I have shown above, put the summary first, and the details second.
- Analyze it: Look for patterns and outliers, then state what they mean for the reader in plain language, the decision or action they point to, not just what the numbers show.
- Recommend Next Steps: End with two or three actions. Then actually do them, and check next time whether they worked.
If you don’t want to go through the hassle of building a productivity report from scratch, grab one of our free employee productivity report templates and adapt it.
Want to clear productivity reports and insights generated every day?
Time Champ shows you accurate employee and team productivity reports.
Quick Tip
Tracking productivity manually is exhausting and inaccurate, too, so let the software gather the data, and spend your energy reading it. Manual collection every week is what quietly kills reporting. If you are dreading the report, that dread is your signal to automate the gathering, not the thinking.
How to Read a Productivity Report Without Jumping to The Wrong Conclusion
Creating a productivity report isn’t enough, you should also know how to read the report, and everyone who can access the report should also know how to read it.
So, read a productivity report in context, not in isolation.
Low logged hours can also mean deep offline work, not always slacking.
High activity can also mean just busywork, not 100% output.
One bad week does not decide a year’s worth of productivity.
Always understand what a number could mean before you act, and read the output along with the activity.
Here is the part almost every guide skips:
- Building a report is easy.
- But reading it well is the actual skill!
These steps help you become a skilled manager, not a reactive one.
Trap 1: Treating Activity as Productivity
A high number of clicks, emails, and active hours feels like productivity, but it can just as easily be someone spinning their wheels (I mean, showing up just busy, not effective). The person with the busiest-looking day is sometimes the one drowning, not thriving. Always read the activity next to the output. If the activity is high but nothing meaningful is shipped, then you definitely need to talk to the employee regarding their performance.
Trap 2: Reading a Number Without Its Context
Low productive hours on Tuesday might mean a slow day, or it might also mean a long client call, a sick kid at home, or three hours of deep design work the tracker couldn’t see. Before you react, ask them what else was going on. The report tells you where to look, not what to conclude with.
Trap 3: Mistaking One Week For a Trend
Everyone has an off week, where they might be going through stress, burnout, or overwork, but if they continue to have such patterns, then that’s a signal.
So, find the signals before sitting on a one-on-one.
Quick Gut Check
Before you act on any number in a report, ask yourself one
thing: "What are three different reasons this number could look the way it does?"
If you can
only think of the unflattering one, you are not ready to have the conversation yet. That pause is the entire
difference between a report that builds trust and one that quietly destroys it.
And here is why this matters beyond fairness.
Always remember, calling your employee for a conversation every time you find an off hour destroys employee morale and exhausts them more.
Gallup found that managers account for at least 70% of the variance in team engagement. The productivity reports do not manage your team, you do. So, the value of a productivity report is not the data itself, it is the quality of the decision you make after reading it.
Read it well, and it builds trust.
Read it badly, and it becomes the reason your best people start updating their resumes to find new corporate families.
A Small Experiment to Try This Week
Pull one honest report on how your team's time actually
went, then sit with it for five minutes before changing anything. Just notice the gap between what you
assumed and what the data shows.
That gap is almost always the most useful thing in the whole report.
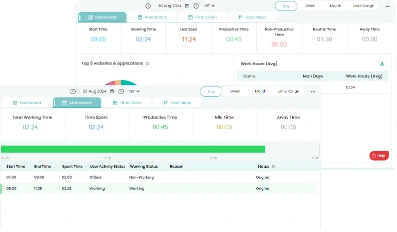
How Time Champ Turns Tracking into Reports You Can Act On
Everything about productivity reporting gets a lot easier when the data is collected automatically. Time Champ is an AI-driven employee productivity and monitoring software, which means it does not just log activity, it turns that activity into reports that actually explain what happened. Time Champ starts gathering data in the background once installed into the system, so you just sit back and view reports and insights.
Here's what Time Champ brings to the table:
- Automatic Data, Zero Manual Entry: Captures productive hours, focus time, idle time, and app usage as people work, so the "gather data" step happens on its own.
- Reports Across Every Level: Provides individual, team, department, and manager views, exportable as PDF, Excel, or CSV, and scheduled to land in your inbox daily, weekly, or monthly.
- Context, Not Just Counts: Shows heatmaps and trends that reveal when focus peaks and where it breaks, so you can read activity next to output instead of guessing.
- Burnout Signals Early: Workload views flag who is overloaded before a deadline is missed, so the well-being metrics are not an afterthought.
Most employee productivity tracking tools stop at activity logs. Time Champ adds the workforce intelligence layer that explains why a number looks the way it does, which, as we just covered, is the part that keeps you from misreading the report. If you want to know more about real-time productivity tracking, we have covered it as well.
Want Automated Productivity Reports?
Time Champ provides customized daily, weekly, and monthly productivity reports
Conclusion
A productivity report is not a verdict on your team, it is a tool for paying attention on purpose. Choose a few metrics that match how you want to assess productivity, lay them out in a format people will read, and end with what you will actually do next. Then, before you act on the numbers, slow down long enough to ask what they really mean.
Build the report for sure, and also build a report reading skill. When you get that right, a productivity report stops being something your team dreads and starts being the reason work runs a little smoother every week.

Shabana Shaik
Table of Content
 What is a Productivity Report?
- What Key Metrics Belong in a Productivity Report?
- What are the Main Types of Productivity Reports?
- What Does a Productivity Report Format Look Like?
- How to Create a Productivity Report? (6 steps)
- How to Read a Productivity Report Without Jumping to The Wrong Conclusion
- How Time Champ Turns Tracking into Reports You Can Act On
- Conclusion
Related Blogs

Learn how to analyze productivity data, identify patterns, avoid common mistakes, and build reports that turn insights into clear, actionable decisions.
Thasleem Shaik | May 01, 2026
Analyze and improve employee performance with lifetime heatmaps that visualize productivity trends, focus peaks, and team engagement patterns over time.
Thasleem Shaik | Mar 18, 2025Productivity Tracking Software helps remote teams stay on top, track progress, streamline workflows & boost efficiency effortlessly. Learn more!
Shabana Shaik | Mar 15, 2025
Discover how to write and interpret employee activity reports to gain insight and drive better business results.
Thasleem Shaik | Jul 10, 2024
Explore the 10 workforce management reports to master your business. Unlock key insights to boost productivity, cut costs, and drive growth.
Chethana | Mar 15, 2025
Get 6 free employee productivity report templates for 2026, designed for daily, weekly, monthly, and team reporting. Simple, customizable, and easy to use.
Shabana Shaik | Jun 11, 2026Ready to Manage Your Workforce Smarter?
Join our family of 1100+ companies using smart insights to redefine workforces!
Free Trial
No Credit Card Required