10 Essential Workforce Management Reports for Businesses
Explore the 10 workforce management reports to master your business. They unlock key insights to boost productivity, cut costs & drive business growth.
Effective workforce management relies on accurate, data-driven insights instead of assumptions. Adequate reporting is crucial to enable businesses to monitor performance, cost management , and enhance staff engagement. Workforce management reports help to gain visibility and assist leaders in making effective decisions.
But what is a workforce management report? It is a structured analysis of employee data that answers questions such as How productive is the workforce? What are the labor costs? How engaged are employees? These reports convert raw data into actionable insights, improving strategies that enhance efficiency, promote compliance, and enhance organizational development.
What Are the 10 Types of Workforce Management Reports?
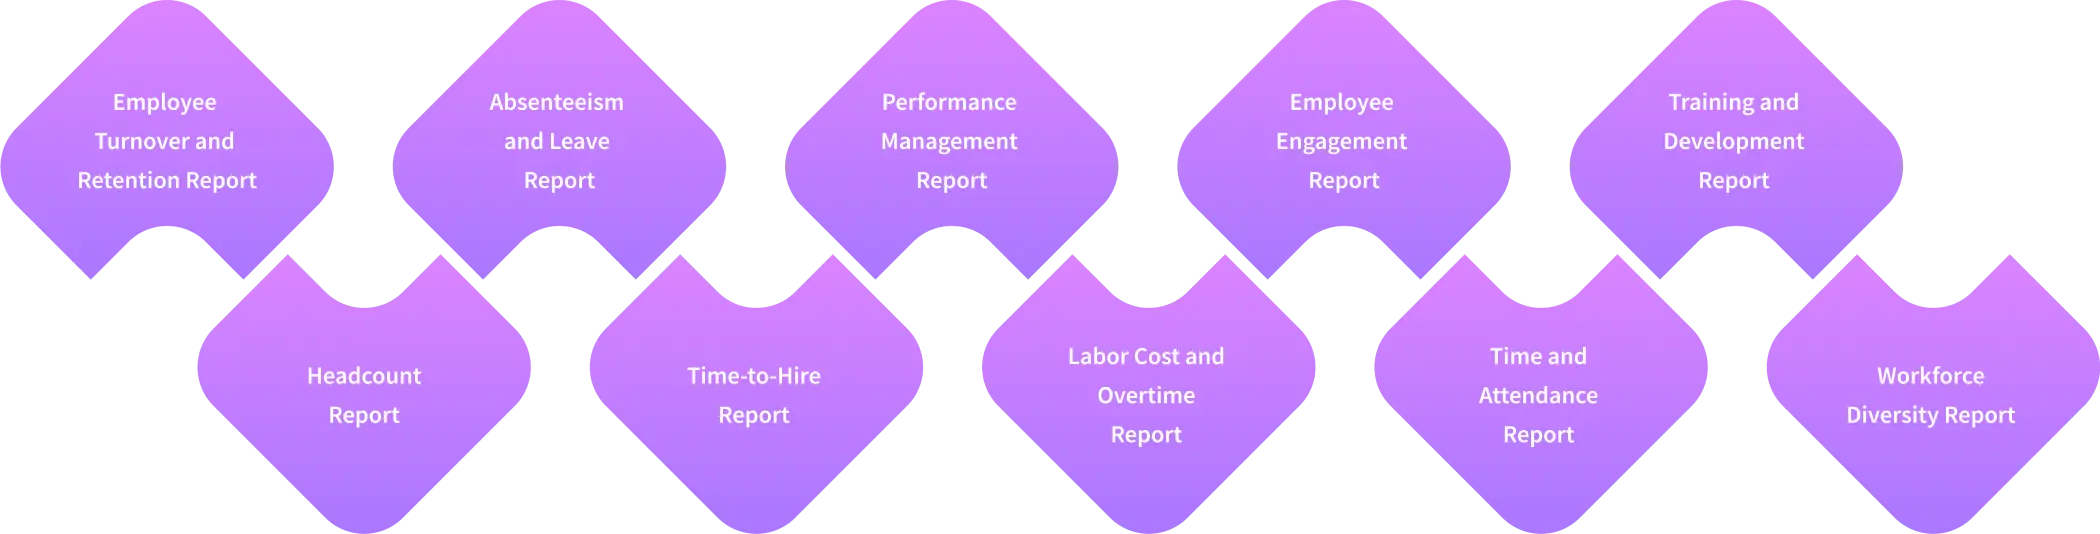
The workforce management reports provide leaders with insights into various areas of employee operations. Each report type has its distinct area that contributes to productivity, cost control, compliance, and employee development. The 10 critical workforce management reports that every business should use are listed below:
1. Employee Turnover and Retention Report
One of the greatest concerns of HR leaders is employee turnover. According to the U.S. Bureau of Labor Statistics (BLS) , the average annual turnover rate in industries was 57.3% in recent years. Using this report, you can track employee exits and get insights regarding voluntary and involuntary departures.
High voluntary turnover typically indicates dissatisfaction with compensation, management, or culture. In contrast, involuntary turnover tends to point out performance or role fit problems. The ability to differentiate the two helps the HR teams to create specific measures to minimize attrition.
The retention tracking in this report identifies the effectiveness of an organization in retaining its workforce. Providing effective onboarding, training programs, and career development initiatives helps strengthen employee retention. Firms that retain better save a lot in terms of rehiring and retraining.
As reported by Wikipedia , employee turnover can be decreased significantly by reducing the replacement costs, both direct (recruiting and onboarding) and indirect (lost productivity and low morale), to range from 30% to 200% of an employee’s annual salary.
2. Headcount Report
A headcount report provides a transparent subdivision of an organization’s total workforce, identifying active employees, part-time workers and contractors and demographics. This information is essential to workforce structure, planning, and strategic decision-making.
Although the exact meaning of a '30% concentration' may vary by organization, most companies assess internal HR staffing ratios to measure efficiency. For instance, a company with 200 employees and 10 HR staff has a 5% HR ratio, which could indicate overstaffing compared to the industry average of 1–3%, according to CompanySights .
Strategic workforce planning and financial forecasting are based on headcount numbers. Headcount data enables the HR and finance departments to equate resource distribution with business goals. According to Mosaic, in SaaS industries, labor expenses can comprise up to 70% of total costs, making precise headcount tracking critical for budgeting and operational efficiency, especially for companies offering SaaS Development Services .
Regulatory compliance is also supported by headcount metrics. In the U.S., companies that employ over 100 workers are required to provide demographic information in accordance with the EEOC requirements. A well-maintained headcount report makes this process easier and transparent.
Absenteeism and Leave Report
Absenteeism and leave reports are used to monitor employee absences such as sick leave, personal days, and other approved time off. With the help of such reports, organizations can track attendance patterns, detect trends, and manage the availability of the workforce effectively. Accurate tracking provides consistency in productivity and operation.
The financial effects of absenteeism are huge. Unplanned absenteeism costs U.S. employers about 225.8 billion a year, or about 1,685 per employee. According to the Bureau of Labor Statistics , the national absence rate of full-time workers in 2024 was 3.2% (BLS).
This report assists organizations in finding the root causes of absenteeism. Continuous absences can lead to burnout or disengagement issues. Management can identify patterns in certain departments and apply interventions such as wellness programs or flexible work hours.
Operational and compliance needs are also supported by absenteeism reports. If absence rates are particularly high, it leads to overtime and temporary workers, increasing labor expenses. Periodic evaluation helps companies to minimize disturbances and sustain an efficient workforce.
Ready to Reduce Absenteeism and Improve Workforce Reliability?
Time Champ helps track attendance, cut downtime, and optimize workforce planning.
Time-to-Hire Report
The Time-to-Hire Report is a metric that counts the days between the date of candidate application and the date of job acceptance. It assists HR teams in analyzing their effectiveness in the recruitment process and detecting bottlenecks. Effective recruitment guarantees the acquisition of the best talent before other companies can offer them.
Globally, the average time-to-hire is approximately 44 days in 2025, as compared to 31 days in 2023, as more screening and interviewing steps are being undertaken, according to Joingenius . Industry-specific averages differ: Retail: 18 days, Hospitality: 14 days, IT: 41 days, Healthcare: 56 days, Engineering: 62 days.
Some of the factors that influence time-to-hire are the complexity of the position, industry demand, and the process involved in recruitment. Technical jobs or specialized positions in high demand usually take up more time to fill. Firms that conduct multiple interview processes or use lengthy background checks also have prolonged recruitment processes.
Reducing time-to-hire enhances competitiveness and operational continuity. Organizations can find talent more quickly, save on vacancy expenses, and remain productive by automating the process of sourcing candidates, conducting screening and onboarding. This makes the Time-to-Hire Report a crucial instrument of strategic workforce planning.
Performance Management Report
The Performance Management Report monitors employee performance in relation to business objectives, providing information on productivity, alignment and impact on the organization. Constant feedback, which is actionable, can contribute to improvement and responsibility.
Studies by McKinsey & Company indicate that firms that focus on effective performance management are 4.2 times more likely to be ahead of the competition, generate 30% higher revenue growth and 5% less attrition. This highlights the strategic importance of performance systems that are well structured.
These findings are supported by other studies: organizations with efficient performance management are 1.5 times more likely to surpass their competitors in terms of financial performance and experience 1.25 times greater productivity, according to a Willis Tower Watson study . In the meantime, annual reviews in isolation are less effective. Teams that get strength-oriented feedback are 8.9% more profitable and 12.5% more productive, as reported by Select Software Reviews .
By regularly analyzing performance trends, businesses can identify high-performers, provide targeted support, and enhance overall productivity. With these insights, organizations can strengthen goal alignment, accelerate revenue growth, and reduce employee turnover.
Labor Cost and Overtime Report
The Labor Cost and Overtime Report records the total labor cost, including wages, benefits, taxes and overtime, that provides organizations with an accurate analysis of how they are spending on their workforce. Labor always constitutes a large part of the business costs. In all industries, labor costs are between 20 to 35% of overall sales, and in service-based businesses, this may go as high as 50% or higher, according to ICTSD. PwC Saratoga Workforce Index indicates that in 2022, the average cost of labor was 22% of the revenue.
Overtime is an additional significant layer of labor cost. In service sectors, overtime may lead to 10-15% of overall labor costs in case it is not managed adequately. This highlights the importance of monitoring and forecasting in effective workforce scheduling.
Compliance and morale-wise, excessive overtime may lead to burnout, errors, and high turnover. It is also an indication of potential understaffing or improper planning of shifts. The tracking of this metric will enable leaders to make effective decisions about staffing, timing, and cost efficiency.
A properly organized labor cost & overtime report allows the leaders to strike a balance between financial discipline and the well-being of the employees. The information in this report can be used to set targets on labour-to-revenue ratios, anticipate changes in the level of staffing, and plan to decrease overtime dependency, eventually enhancing profitability and stability in operations.
Employee Engagement Report
This report looks at the employee motivation, satisfaction and emotional investment levels in their work. Employee engagement is an indicator of how engaged and passionate individuals are about their work, which has a direct impact on business results and organizational culture.
According to the research conducted by Gallup , it has been identified that highly engaged teams are linked to 14% more productivity, 23% more profitability, and 10% more customer loyalty and that their absenteeism is 78% lower and turnover is 21-51% lower based on turnover levels.
Poor engagement is simply too expensive: Disengaged workers worldwide cost the global economy $8.8 trillion in lost productivity , about 9% of the global GDP.
The report will enable leaders to create specific engagement programs, such as recognition programs, career development, or better manager support, that lead to less absenteeism, higher retention, and greater performance and customer results.
Wonder How Engaged Your Employees Really Are?
Unlock actionable insights with Time Champ’s real-time engagement tracking and boost retention!
Time and Attendance Report
The Time and attendance report follows the behavior of the employees regarding clock-in/out, total number of working hours, and schedule compliance. It assists organizations to keep accurate payroll, minimize errors, and ensure equitable pay, which is essential in both financial accuracy and employee trust.
Research by Timetrex indicates that workers waste 4 or 4.5 hours per week at work through time theft, comprising lateness, early leaving, long breaks and buddy punching. This steady loss has a huge effect on productivity and payroll accuracy.
These losses are enhanced by manual time-tracking practices. According to the American Payroll Association, manual processing of timecards costs employers around 5 minutes per card, and mistakes related to miscalculations may cost 1% to 8% of their gross annual payroll, as reported by TimeWellScheduled . In the case of companies that have a large number of employees, such inefficiencies soon translate into huge financial wastage.
Timely and accurate attendance reporting assists in the identification of inefficiencies and imposition of scheduling discipline. Businesses can reduce time theft and audit errors by over 95% by adopting automated time-tracking tools , enhancing payroll accuracy and operational efficiency .
Training and Development Report
The Training and Development Report measures the extent to which learning programs affect employee skills and career development, as well as the organizational performance as a whole. It measures both participation levels, training expenses, skill development, and business results, such that investment in learning and development (L&D) can bear quantifiable results.
The Association of Talent Development (ATD) reported that organizations that have extensive training programs have a 218% higher income per employee and 24% higher profit margin than organizations that do not make training a priority. This shows how training helps to improve profitability and efficiency.
Further evidence indicates that 94% of staff members claim that they would remain longer in a firm that would invest in their education and professional growth. Well-structured training programs can be used to enhance the performance of employees , as well as decrease the level of turnover, reduce the cost of hiring and increase the stability of the workforce.
Regularly analyzing such reports, organizations would be able to align L&D with strategic objectives, bridge skill gaps, and support employee engagement. Properly implemented training programs lead to improved productivity , enhanced innovation and long-term growth.
Workforce Diversity Report
The Workforce Diversity Report measures the level of representation of employees based on gender, age, ethnicity, disability, and other aspects of diversity. It gives insight into the extent to which organizations are inclusive and assists the leadership in monitoring the progress of achieving diversity, equity, and inclusion (DEI) objectives.
According to McKinsey research, the most diverse companies in terms of gender representation on executive teams are 25 times more likely to experience above-average profitability, whereas the most diverse companies in terms of ethnic and cultural diversity are 36 times more likely. These numbers highlight the connection between diversity and improved business performance.
There are still problems, despite the progress. According to the World Economic Forum's Global Gender Gap Report 2023 , While women make up about half of the global workforce, they occupy only 32% of senior management roles, highlighting a significant leadership gap. Similarly, research indicates that organizations that have more racial and ethnic diversity are better placed to succeed financially, but still, disparities in inclusion persist.
A workforce diversity report can assist organizations in recognizing underrepresentation, comparing themselves to industry best practices, and establishing quantifiable DEI objectives. Through data-driven diversity reporting, companies can promote inclusivity, innovation, and resilience in the long term.
Conclusion:
Workforce management reports convert complicated employee data into clear information that aids in making better decisions. By monitoring these reports regularly, you can control your expenditures, increase efficiency, and engage employees more, establishing a more robust foundation for future expansion.
Want to See What Your Workforce Data Reveals?
Turn real-time insights into smarter decisions, higher productivity, and a stronger workforce with Time Champ today!

Chethana

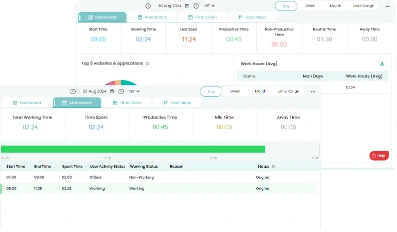
Table of Content
-
 What Are the 10 Types of Workforce Management Reports?
-
2. Headcount Report
-
Conclusion:
Related Blogs
Workforce management software is a set of tools and processes designed to improve employee productivity in a business.
Mounika Sai | 08 January 2024
Unlock strategic insights and optimize performance with our guide on Workforce Analytics—maximize potential, drive efficiency, and achieve business success.
Mounika Sai | 08 January 2024
Discover how to use timesheet reports to track progress, manage time effectively, and ensure project success with better planning and efficiency.
Sai Keerthi Uppala | 17 September 2024
Discover how attendance reports increase team efficiency by tracking attendance, making the right decisions, and boosting morale among the workforces.
Thasleem Shaik | 22 June 2024
Discover how to write and interpret employee activity reports to gain insight and drive better business results.
Thasleem Shaik | 10 July 2024
Learn 10 essential hybrid workforce best practices to boost productivity, improve communication, and foster team morale for success in a flexible work setup.
Shabana Shaik | 03 June 2024Ready to Manage Your Workforce Smarter?
Join our family of 1500+ companies using smart insights to redefine workforces!
Free Trial
No Credit Card Required