How to Track Team Productivity: A Guide to Measuring Output
Track team productivity without watching people: 8 metrics with formulas, the three that fit your team, and how to spot when your numbers are being gamed.
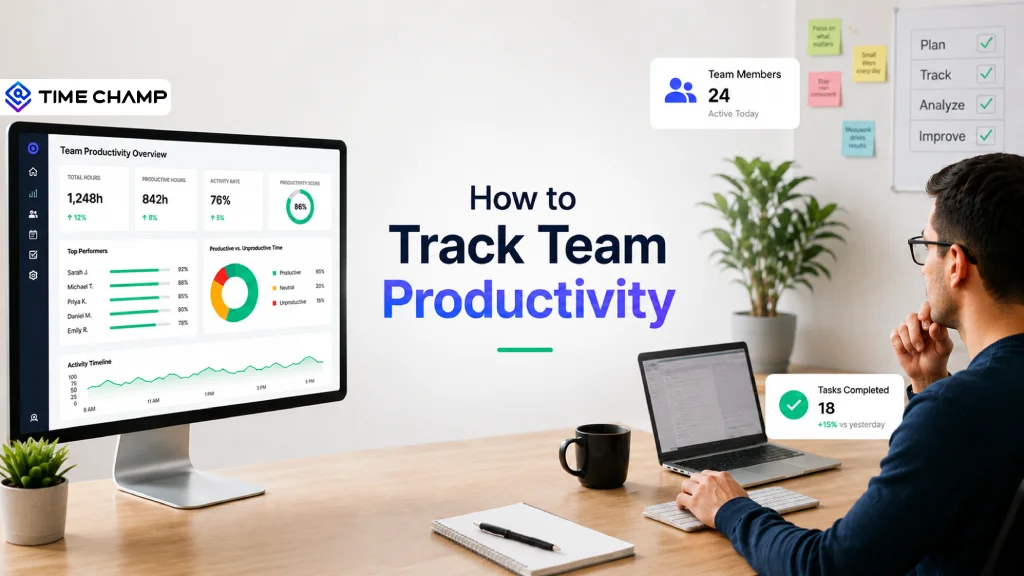
People can’t get over the fact that they can track team productivity no matter where they work from, and there are hundreds of ways the internet teaches how to, but this article shows how to do it both effectively and ethically, so your employees don’t feel watched over all the time.
I will keep it practical: what team productivity actually means, eight metrics with the formulas and worked examples, how to choose the right ones for the kind of team you run, and the part most guides skip entirely, why productivity metrics get gamed and what to do when yours already has been. Let us get into it.
What Is Team Productivity?
Team productivity is the amount of meaningful output a team delivers relative to the resources it consumed, usually expressed as output divided by input. The input is normally time or headcount. The output is whatever your team actually exists to produce, shipped features, resolved tickets, closed deals, delivered campaigns. It is not hours logged, and it is not how busy anyone looked while producing it.
The formula for this is very simple:
THE FORMULA
Team productivity = Total output ÷ Total input
The hard part was never the arithmetic, it was agreeing on what counts as output and being honest about which inputs you are actually paying for.
Most teams get stuck on the numerator. Ask five managers what their team produced last month, and you will get five different measures, some of which are not measures at all (My favorite being "a lot of progress"). This is exactly why productivity tracking fails, it’s not a tooling gap, but definitely a definition gap.
Team Productivity vs Individual Productivity: Why the Distinction Matters
Individual productivity measures what a person truly delivers. Team productivity measures what the group delivers together, including the cost of coordinating that work. They are not the same, and they often can move in opposite directions too.
Here is where teams get caught out: If everyone optimizes their own output, you can end up with a whole mountain of finished-looking work and very little that reaches the customer because nobody really cares to own the handoffs (everybody thinks it’s the other’s job). Individually, everyone looks excellent, collectively, the team is completely stuck. If you only measure individuals, you miss the real problem because it lives in the gaps between them.
There is another uncomfortable reason this matters: Individual metrics are easier to manipulate than team metrics because the incentive falls only on one person. I will come back to that properly further down.
Why Track Team Productivity at All?
Managers usually track team productivity to find out where work slows down, whether effort is landing on the things that matter, and how much capacity they genuinely have before committing to more. If it is done well, it protects the team from overcommitment, and if done badly, it becomes a surveillance exercise that produces worse work and quieter people.
These four reasons hold up well in practice:
- It Shows You Trends, Not Faults: When three people's cycle time increases in the same fortnight, it may not mean three people are slowing down. It could simply mean one handoff is slowing everyone down. This is not about blaming individuals, it is about finding process bottlenecks. Once you see where work is getting stuck, the conversation shifts from people to the process holding them up.
- It Connects Effort to Priorities: Most teams are busy, but being busy does not mean working on what matters most this quarter. You cannot see that difference just by watching activity.
- It Makes Workload Distribution Visible: Almost every team has two people quietly handling more than their share of the work. Proper measurement helps spot them before they burn out or leave.
- It Makes Capacity Planning Honest: Saying yes to a new project is a guess until you know how much your team actually delivers in a normal month.
And the payoff is measurable at scale: Gallup’s Q12 meta-analysis, covering 183,806 business units, found that teams in the top quartile for engagement are 23% more profitable and 18% more productive than those in the bottom quartile (Gallup, 2024). Measurement does not create this gap, it just shows you where your team stands.
A GUT-CHECK TIME
Question yourself: if you could only see your team's finished outcomes and never their activity, would you still be able to name who is doing great work this month?
If the answer is no, the problem is not your people, and it is not your tool. It is that you have been measuring motion and calling it output. Everything below is about fixing that.
Busy ≠ Productive!
Time Champ shows you what work actually produced, not just activity!
8 Metrics to Track Team Productivity (With the Formulas)
These eight metrics cover output, speed, quality, value, and capacity.
You definitely do not need all of them, all you need are the three that fit your team, which I will get to in the next section. Each one comes with the formula and a worked example, because a metric you cannot calculate is a metric you will not use.
| Metric | Formula | What It Actually Tells You | Leading or Lagging |
|---|---|---|---|
| Task completion rate | Completed ÷ assigned × 100 | Whether workload matches capacity | Lagging |
| Planned-to-done ratio | Completed ÷ planned × 100 | Whether priorities are holding | Lagging |
| Cycle time | Net production time ÷ tasks done | Where the process is jamming | Leading |
| Revenue per employee | Revenue ÷ headcount | Whether output is scaling with headcount | Lagging |
| Deadline adherence | Met ÷ set × 100 | Predictability, which is what stakeholders feel | Lagging |
| Rework rate | Reworked ÷ delivered × 100 | Whether speed is costing you quality | Lagging |
| Focus time ratio | Focus time ÷ working time × 100 | How much of the day is real work | Leading |
| Capacity utilization | Productive hrs ÷ available hrs × 100 | How close the team is to having no slack | Leading |
Did you notice that only three of the eight are leading indicators. Those three are the ones that give you time to act. The other five tell you what already happened, which is useful for reporting and almost useless for intervention.
Team-wise Metrics to Track
Pick three metrics that match what your team produces, not the three that are easiest to pull right away from your tool.
Cycle time is meaningless for a marketing team.
Rework rate is close to useless for sales.
Most productivity tracking fails at exactly this step, because the metric list gets copied from an article instead of being chosen for the work.
So here is the version I would actually use:
| Team Type | Track These Three | Because | Skip |
|---|---|---|---|
| Software / engineering | Cycle time, rework rate, planned-to-done | Speed means nothing without escaped defects next to it | Revenue per employee |
| Customer support | Cycle time, rework rate, capacity utilization | Reopened tickets are the only honest quality signal | Planned-to-done |
| Marketing / creative | Planned-to-done, deadline adherence, focus time | Output is lumpy and uncountable, so predictability matters more | Cycle time |
| Sales | Deadline adherence, capacity utilization, revenue per employee | The output is already countable in currency | Rework rate |
| Agency / professional services | Capacity utilization, deadline adherence, rework rate | Utilization is the business model, rework is what silently eats the margin | Task completion rate |
| Operations / back office | Cycle time, task completion rate, rework rate | Repeatable work is where cycle time is most reliable | Revenue per employee |
How to Track Team Productivity in 6 Steps
Tracking team productivity is an ongoing process, not a one-time dashboard setup. The process matters more than the tool because most productivity measurement mistakes happen in the first two weeks, before everyone agrees on what to measure and how to read it.
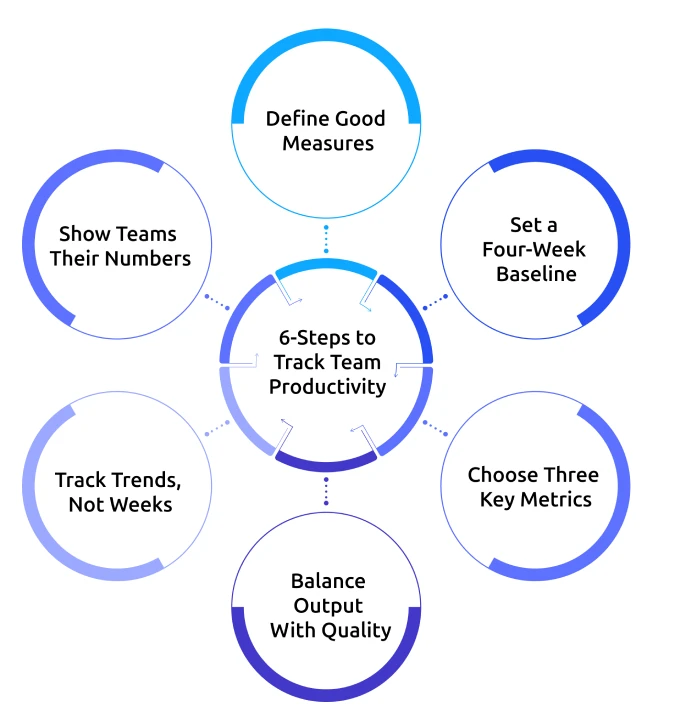
Step 1: Define What Good Looks Like Before You Measure Anything
Before you start any kind of tracking, first sit down and write what a good week produces it can be just a sentence per role.
If that feels hard, that’s what you need to find.
Gallup found that just 46% of employees clearly know what is expected of them at work, down ten points from 56% in March 2020 (Gallup, 2025). If fewer than half your team knows what good performance looks like, adding more metrics won’t help. It will only measure the confusion more clearly.
Step 2: Set a Baseline and Leave It Alone for Four Weeks
Measure for four weeks before you draw a single conclusion or change a single thing. You are not looking for a number here, you are looking for the normal range, including how much it wobbles week to week. Without that range, you surely cannot tell a real change from an ordinary Tuesday, and you will end up reacting to plain noise.
This is the step teams skip most often (usually because someone senior wants a number by Friday), and it is the step that determines whether everything after it means anything.
Step 3: Pick Three Metrics, Not Eleven
Picking just three is not a compromise, it’s actually the whole point. Every metric you add costs attention, invites gaming, and gives people one more thing to optimize instead of doing the actual work. Use the table above, take one output metric, one speed metric, and one quality metric, and let the rest go.
If a metric has not changed a decision in three months, retire its term. Dashboards accumulate metrics the way garages accumulate boxes, and nobody ever throws one out.
Step 4: Pair Every Output Metric With a Quality Metric
This is the non-negotiable one: Any output number can be improved by lowering the bar, and a team under pressure will find that route without anyone deciding to.
Tasks completed sits next to rework rate, tickets closed sits next to reopen rate, and deals closed sit next to churn at 90 days.
Measure output alone and you will not just build a productivity system, but also a speed system that will eventually cost you a customer.
Step 5: Read the Trend, Never the Week
A bad week doesn’t always mean there’s a real problem. It could be a holiday, an outage, a product launch, or someone being out sick. Reacting to that one bad week can make your team see the dashboard as a threat instead of a helpful tool.
Set a clear review cadence: weekly for a quick look, monthly for a conversation, and quarterly for strategic decisions. Don’t make major changes based on just seven days of data.
Step 6: Show the Team Their Own Numbers First
Let people access their own data before you give it to anyone else above them, and show the data as it is, without adding assumptions or judgments about what it means. Two things happen when you do this: The metrics get more accurate because people correct the ones that are wrong, and they stop feeling like something is being done to the team.
It also puts the ownership in the right place.
If a team sees that their work is taking longer, they’ll usually notice and raise the issue themselves before you need to step in.
Your Team Should See Their Own Numbers Before You Do!
Time Champ gives employees visibility into their own work patterns, with role-based access controlling everything else.
Why Productivity Metrics Get Gamed
Productivity metrics get manipulated because people substitute the metric for the goal it was meant to represent. Researchers call this surrogation, and it is not a character failing, it is what happens automatically when a number becomes the thing everyone is judged on.
Harvard Business Review documented the mechanism and its most expensive example. Wells Fargo employees chasing a cross-selling metric opened 3.5 million accounts without customer consent. The authors' conclusion is worth pinning above any dashboard: every day, at almost every company, strategy is being hijacked by numbers (Harvard Business Review, 2019).
You probably won’t face something this extreme. But you may see a smaller, everyday version of it, it may look like this:
SITUATION: THE SUPPORT TEAM THAT GOT 30% FASTER OVERNIGHT
A support desk put tickets closed per agent on a wall dashboard. Within a month, closures were up almost a third, and everyone was pleased. What had actually changed was that agents had started splitting one customer issue into three tickets, closing each one, and waiting for the customer to come back for the rest. Reopen rates rose by roughly the same amount. Nobody noticed because reopen rate was not on the wall.
Nobody in this story did anything dishonest. They simply responded to what was being measured, which is what metrics naturally push people to do. That is the whole risk in one sentence.
Trap 1: Treating Activity as Output
Keystrokes, logged hours, message volume, and green status dots measure presence, not production. They are easy to collect, which is precisely why they end up on dashboards, and they reward the person who looks busiest rather than the person who finished the hard thing quietly on Tuesday.
Trap 2: Measuring People When the Problem Is the System
If four people on the same team slow down on the same day, it is most unlikely that all four suddenly lost motivation. Something else probably changed, an approval is stuck, a tool is slowing them down, or a new dependency has appeared. Looking at individual metrics points to four people and can make you miss the one thing affecting them all.
Trap 3: Reading One Week as a Trend
The most common, and often the most damaging one, because it starts with good intentions. A manager sees a dip and quickly steps in to help. But the team learns that even a normal dip will trigger a conversation. Soon, they start managing the number instead of the work.
There is also evidence that heavy monitoring can produce the opposite of what it intends. Researchers writing in Harvard Business Review found that across two studies, monitored employees were substantially more likely to break rules, including cheating on a test and deliberately working slowly, than unmonitored employees doing the same work.
Source: Harvard Business Review, 2022. Their reading was that being watched shifts responsibility for behavior from the person to the watcher.
How Time Champ Helps You Track Team Productivity by Outcome
Time Champ is employee monitoring and productivity tracking software with a workforce intelligence layer, which means it is built to show how work actually flows and where output happens, not just whether a keyboard was moving. Most tracking tools stop at the activity log, the intelligence layer is the part that turns that log into the metrics above.
What you can use for the eight metrics:
- Project and task-level time reports that show where the team spent its time, so you can calculate task completion rate and cycle time accurately.
- Automatic time tracking across projects, tasks, and clients, so you have the actual data instead of trying to piece it together at the end of the week.
- Kanban boards and project status tracking showing what is not started, in progress, completed, or verified. This helps you track planned work against completed work and see whether deadlines are being met.
- Productivity classification that labels apps and websites as productive, non-productive, or neutral based on rules you set for each team.
- Work-life balance overview showing focus time, breaks, and overwork. This helps you track focus time and spot workload problems early.
- Timeline views and visual heatmaps showing work hour by hour and week by week, so you can see patterns instead of judging performance from a single day.
- Team and individual comparisons that help you see whether a problem affects one person or the whole team.
- Budget tracking by hours or cost with real-time alerts, along with budget-versus-actual reports, so you can see when work is using more time or money than planned.
- Resource allocation and capacity planning so you can move work around once you know where the workload is going.
- Role-based access and encrypted storage, so only the right people can see the data.
These two boundaries are worth stating plainly: Time Champ produces performance analytics, not review forms or 360-feedback workflows, so it feeds your appraisal process rather than replacing it. It also generates payroll-ready timesheet exports rather than processing payroll itself.
And the setup matters more than the feature list. Define what productive means per role before you switch anything on, give employees their own view first, and make sure the first visible consequence of a bad number is workload moving rather than someone being asked to justify a Tuesday.
A Few Final Words
Tracking team productivity is not really a monitoring problem, it’s a problem of not knowing what to measure. Most teams already have plenty of data they can use, you just need to know if the work that really matters is actually moving or not. One last reminder before we wrap up:
Pick three metrics that match your team’s work, and pair every output metric with a quality metric. Set a baseline and leave it alone for at least a month, also look at the overall trend, not just one bad week, and let people see their own data before anyone else does.
The checklist is simple:
- Define good work
- Measure three things
- Pair speed with quality
Stop counting activity that does not move any work forward!
Do this, and productivity stops being a number you defend in a meeting and becomes something you can actually see.

Shabana Shaik

Table of Content
 What Is Team Productivity?
- Team Productivity vs Individual Productivity: Why the Distinction Matters
- Why Track Team Productivity at All?
- 8 Metrics to Track Team Productivity (With the Formulas)
- Team-wise Metrics to Track
- How to Track Team Productivity in 6 Steps
- Why Productivity Metrics Get Gamed
- How Time Champ Helps You Track Team Productivity by Outcome
- A Few Final Words
Instant Signup
Thank you for your request!
We have received your signup request and our team will get back to you soon. In the meantime, you can book a demo to see Time Champ in action.
Book a DemoFree trial. No credit card required. Prefer a walkthrough? Book a demo.
Related Blogs

Learn how to track productivity in the workplace using proven methods, role-based metrics, and tools. A practical 2026 guide for modern managers and teams.
Jahnavi Pulluri | May 06, 2026
Learn how to calculate productivity using simple formulas, practical methods, and real examples to measure employee performance accurately.
Thasleem Shaik | May 20, 2026
Track the right remote worker productivity metrics to understand performance, improve output, and avoid micromanagement with clear insights.
Thasleem Shaik | Apr 24, 2026
Learn how to analyze productivity data, identify patterns, avoid common mistakes, and build reports that turn insights into clear, actionable decisions.
Thasleem Shaik | May 01, 2026
Turn hybrid teams into high performers with hybrid team productivity strategies that improve results, visibility, collaboration, trust, and accountability.
Anjali | Jun 19, 2026
Learn how employers can create, implement, and track a Performance Improvement Plan (PIP). Get expert advice on managing PIP strategies effectively.
Thasleem Shaik | August 08, 2025


 4.7/5 avg.
Ready to Manage Your Workforce Smarter?
Join our family of 1500+ companies using smart insights to redefine workforces!

Free Trial
No Credit Card Required