Schedule Variance Calculator
Small schedule gaps can lead to serious delays. Our schedule variance calculator quickly compares earned value and planned value to show whether your project is ahead, on track, or behind schedule.
Schedule Variance Calculator
Schedule Variance (SV)
$0
Status Indicator
🟡 On Schedule
Performance Index (SPI)
0.00
Variance Percentage (SV%)
0%
What is the Schedule Variance Calculator?
A schedule variance calculator is a project management tool that measures the difference between the work your team was supposed to complete by a specific date and the work actually completed, expressed in monetary terms. It gives you definite numbers whether your project is ahead of schedule, behind schedule, or on schedule.
Once you have that number, decisions become easier. You know where to reallocate resources, which tasks need urgent attention, and how to report progress to stakeholders without guesswork. It removes the vague "we think we're on track" conversations and replaces them with data your entire team can act on.
Key Terms You Need to Know
- Planned Value (PV) / BCWS (Budgeted Cost of Work Scheduled): The budgeted cost of work you planned to finish by a specific date.
- Planned Value (PV) / BCWS (Budgeted Cost of Work Scheduled): The budgeted cost of work you have actually completed so far.
- Actual Cost (AC): The real amount of money spent to get that work done.
- Schedule Variance (SV): It is simply EV minus PV. A positive result means you are ahead of schedule. A negative result means you are behind. Zero means you are exactly where you planned to be.
- Schedule Performance Index (SPI): A ratio that measures how efficiently a project is progressing against the plan, calculated by dividing earned value (EV) by planned value (PV).
Why Should You Use the Schedule Variance Calculator?
Keeping a project on schedule requires more than reviewing task lists. You need a reliable way to measure whether actual progress is matching your original plan. A schedule variance calculator gives you that clarity in numbers. Below are the major reasons why it is important and how it will be useful in keeping you in control of your delivery.
- Spot Delays Before They Grow: Even small delays can gradually turn into bigger problems if you miss them early. This calculator highlights schedule deviations instantly, allowing you to step in before the gap expands and disrupts your timeline.
- Understand Your Actual Schedule Performance: Task lists and status updates only tell part of the story. Comparing the planned and the actual work done gives you a clear picture of the progress of your project, rather than using assumptions or optimistic updates.
- Keep Your Team Aligned and Focused: A clear schedule variance number helps everyone understand where the project stands. It eliminates misunderstandings, unnecessary back-and-forth, and makes sure that the whole team is working towards the same objectives and priorities.
- Make Confident Decisions Without Guesswork: Resource shifts, timeline adjustments, and priority changes become easier when you have data backing your choices. The calculator gives you the clarity you need to move forward with confidence instead of reacting out of pressure.
- Prevent Last-Minute Rush and Chaos: Unexpected delays will probably result in rushed catch-up work, stressed teammates, and low-quality output. Tracking variance consistently helps you stay ahead of issues instead of scrambling to fix them at the final moment.
How to Use the Schedule Variance Calculator?
No complicated setup, no learning curve. Just three quick inputs and your result is ready. Here is how it works.
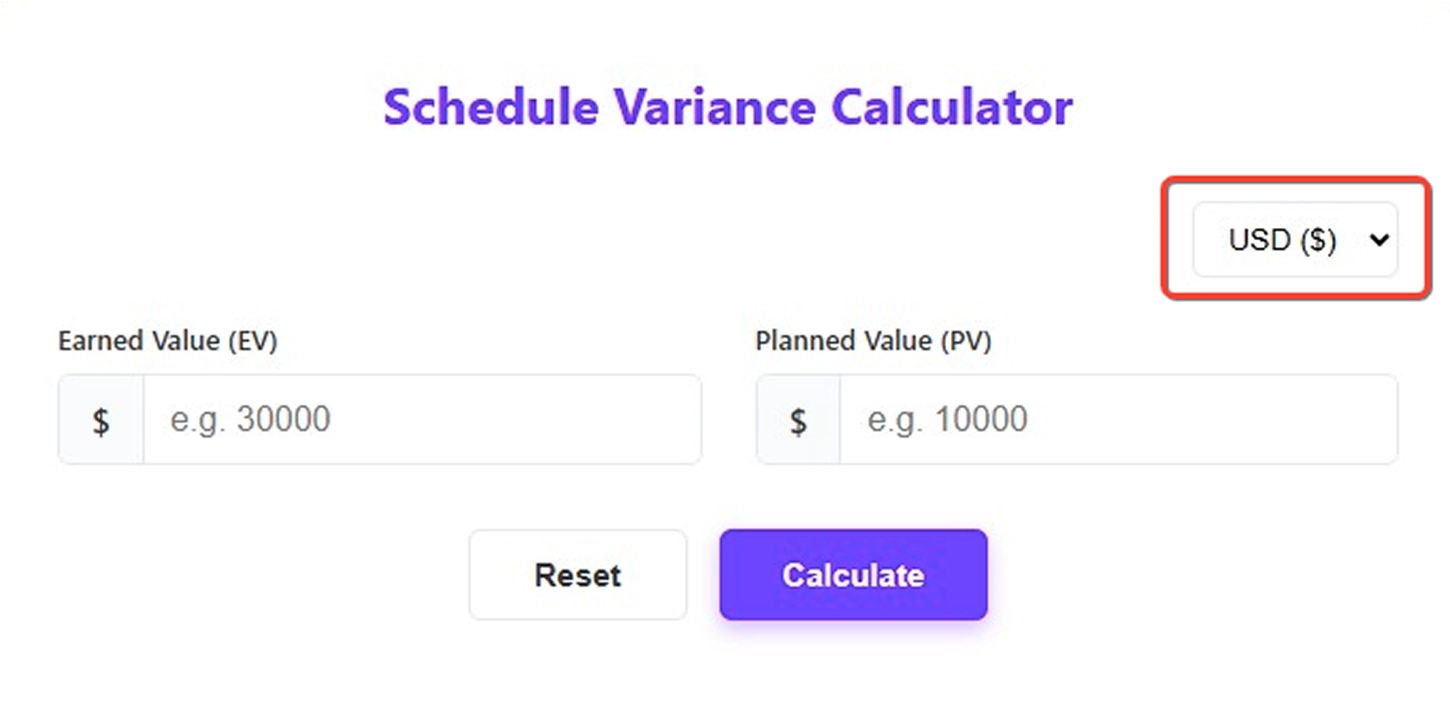
Step 1: Select Your Currency
Start by choosing your preferred currency from the dropdown at the top. The calculator supports multiple currency symbols, so your results match the currency used in your project budget.
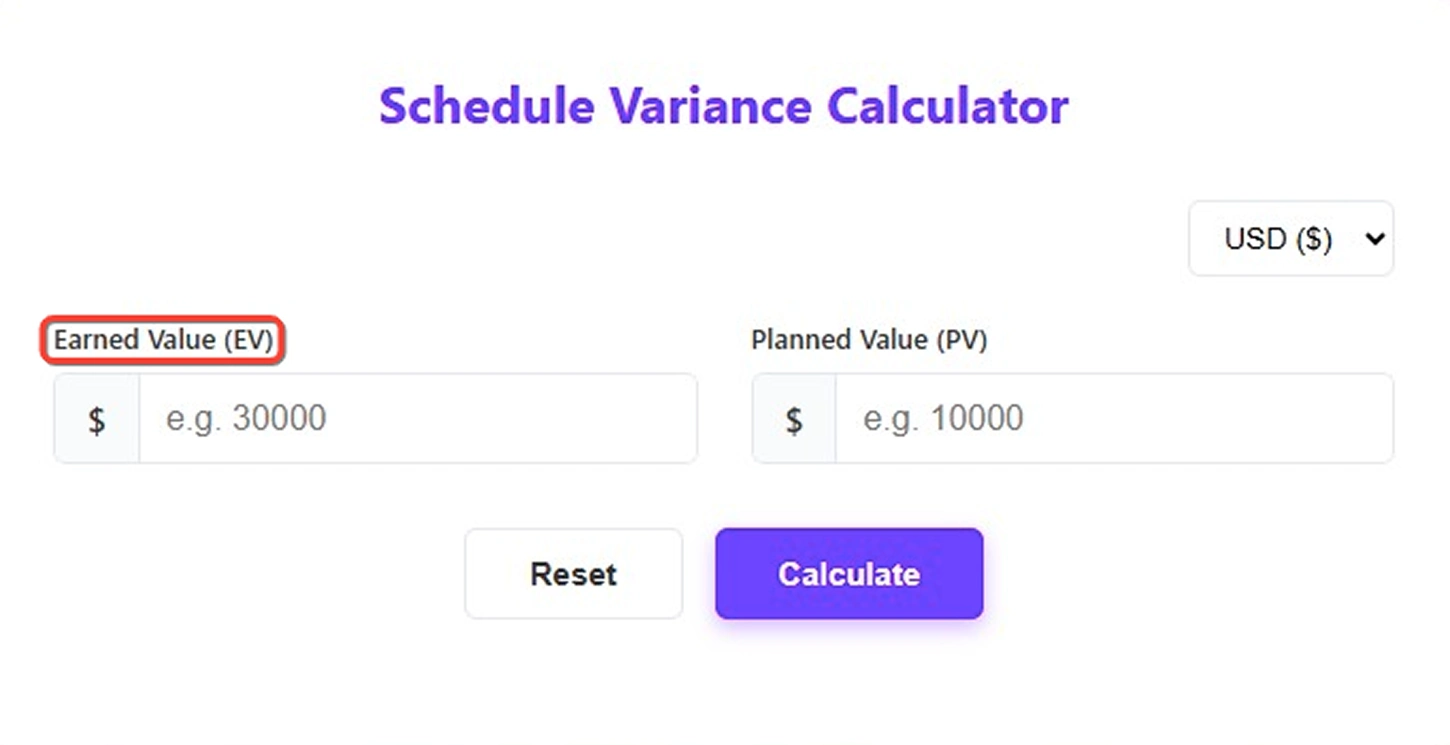
Step 2: Enter Your Earned Value (EV)
In the Earned Value field, enter the budgeted cost of the work your team has completed so far. This is not the amount spent. It is the value of the work done according to your project plan.
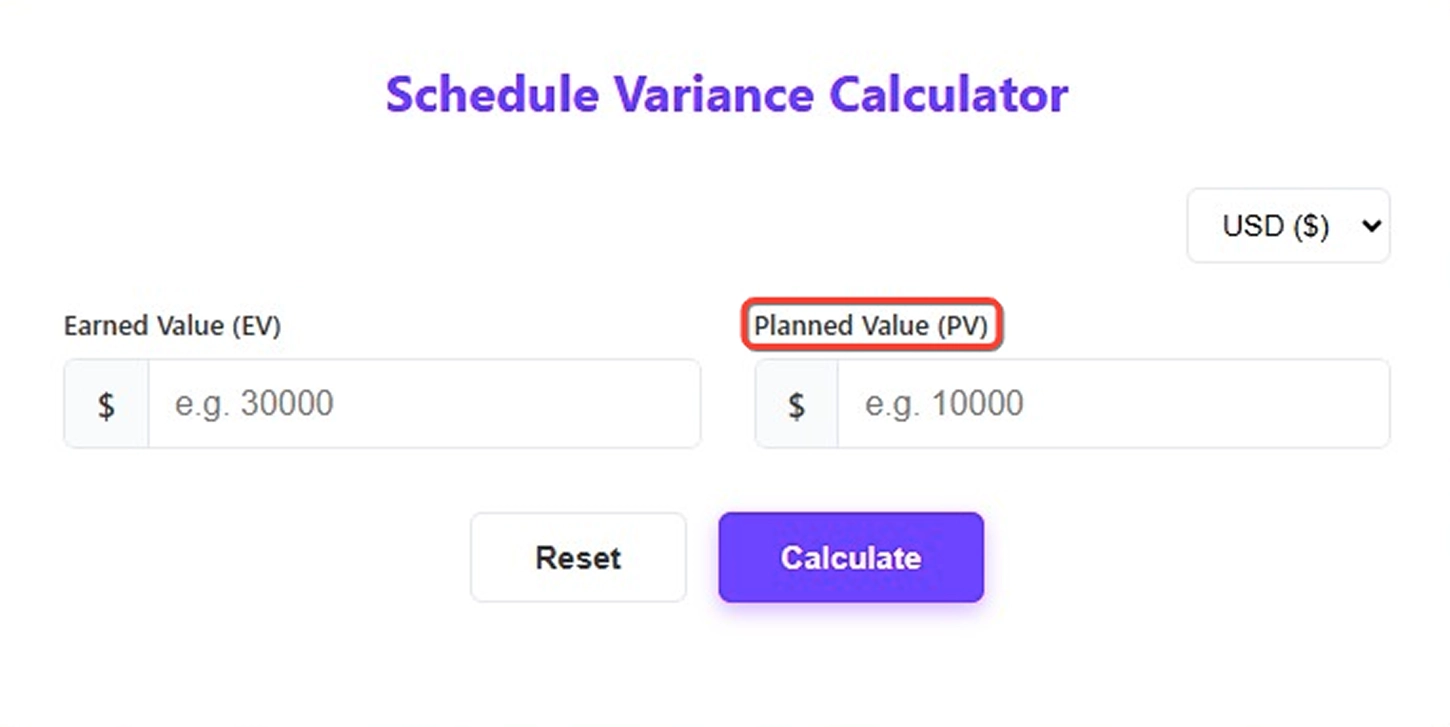
Step 3: Enter Your Planned Value (PV)
In the Planned Value field, enter the budgeted cost of the work you expected to complete by this stage. This figure comes directly from your approved project baseline.
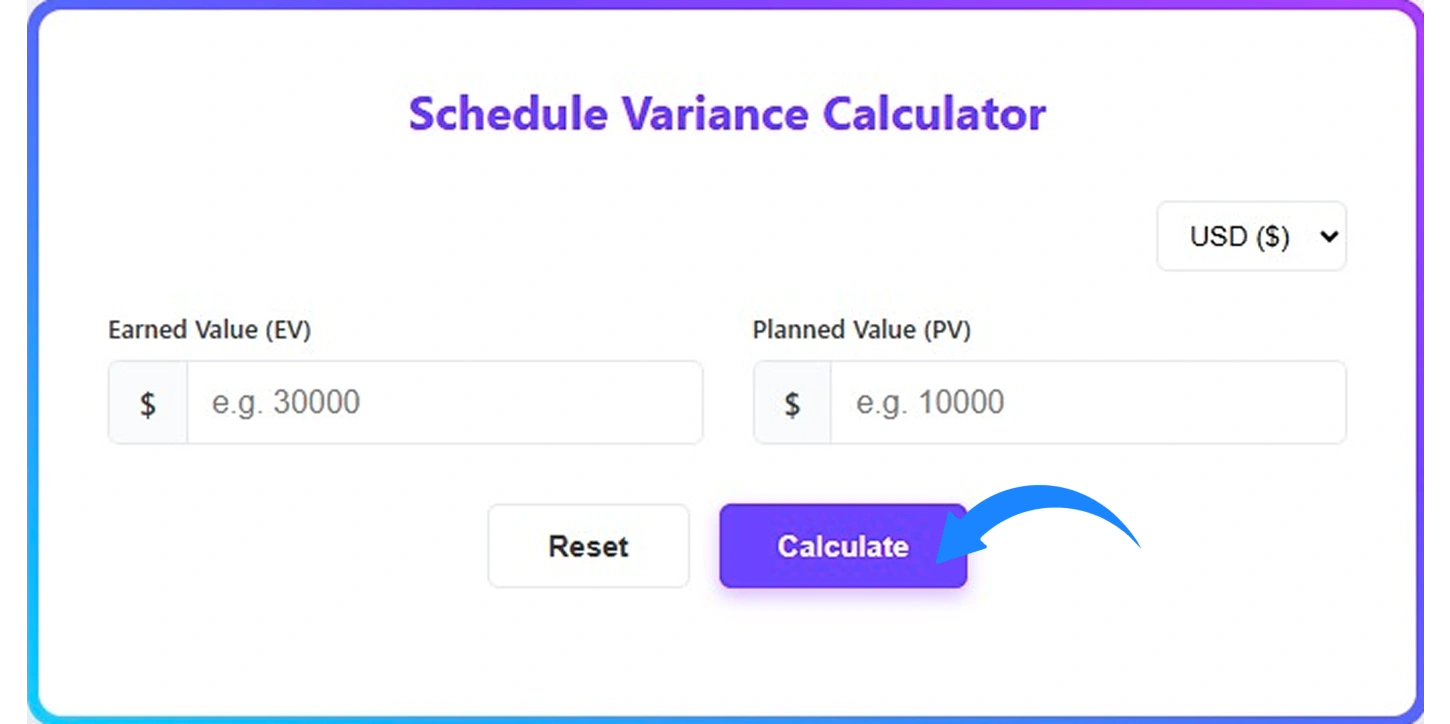
Step 4: Hit Calculate
Once both values are entered, click Calculate. The calculator will instantly process the numbers and generate the results.
Step 5: Review the Results
After calculation, the tool displays several key outputs:
- Schedule Variance (SV): Shows the difference between Earned Value and Planned Value.
- Status Indicator: Shows the schedule condition using color signals: Yellow – On schedule, Green – Ahead of schedule, Red – Behind schedule
- Schedule Performance Index (SPI): Indicates schedule efficiency based on completed work versus planned work.
- Variance Percentage (SV%): Shows the percentage difference between planned progress and actual progress.
How to Calculate the Schedule Variance?
The math behind schedule variance is simple, and anyone can follow it. Here is how to go from raw numbers to a clear, confident project status in just a few steps.
Step 1: Identify Your Earned Value (EV)
Earned Value represents the budgeted cost of the work that has been completed so far.
For example
If your team has completed work that was originally budgeted at $40,000, then:
EV = $40,000 , this number reflects completed scope, not actual spending.
Step 2: Identify Your Planned Value (PV)
Planned Value is the budgeted cost of the work that was scheduled to be completed at this stage of the project.
For example
If your plan shows that by now you should have completed work worth $50,000, then:
PV = $50,000, this comes directly from your project baseline.
Step 3: Apply the Schedule Variance Formula
Subtract Planned Value from Earned Value.
Use the standard earned value management formula:
SV = EV − PV
SV = $40,000 − $50,000 = −$10,000
Step 4: Calculate the Schedule Performance Index (SPI)
SPI measures how efficiently your project is progressing against the plan.
The formula is
SPI = EV ÷ PV
SPI = 40,000 ÷ 50,000 = 0.80
Step 5: Calculate the Variance Percentage (SV%)
The variance percentage expresses the schedule variance as a proportion of the planned value, making it easier to communicate the size of the gap in percentage terms.
Variance Percentage Formula is
SV% = (SV ÷ PV) × 100
SV% = (−10,000 ÷ 50,000) × 100 = −20.00%
This means the project has completed 20% less work than what was planned at this point in time.
Step 6: Interpret the Result
- Positive value → Ahead of schedule
- Negative value → Behind schedule
- Zero → Exactly on schedule
In this example, the result is −10,000, which means the project is behind schedule because less work has been completed than originally planned at this point in time.
Here is a summary of all results from this example:
| Metric | Formula | Calculation | Column Result |
|---|---|---|---|
| Schedule Variance (SV) | EV − PV | 40,000 − 50,000 | −$10,000 |
| Status Indicator | Based on the SV sign | SV is negative | Behind Schedule |
| Performance Index (SPI) | EV ÷ PV | 40,000 ÷ 50,000 | 0.80 |
| Variance Percentage (SV%) | (SV ÷ PV) × 100 | (−10,000 ÷ 50,000) × 100 | −20.00% |
Quick Reference
| Result | What It Means |
|---|---|
| SV > 0 | Ahead of schedule |
| SV = 0 | Exactly on schedule |
| SV < 0 | Behind schedule |
The calculation is done. Now the real question begins.
Is your project gaining ground, slipping behind, or holding steady?
Understanding the meaning behind the number is where better decisions start. Let’s explore it.
Interpreting Schedule Variance Results
The numerical result of the SV formula carries significant meaning for stakeholders. The interpretation falls into three clear categories:
Positive Schedule Variance (SV > 0)
When SV is a positive number, the project is ahead of schedule. The team has completed more work than was planned for the current reporting period. This is usually a good situation, but it can also lead to an investigation to ensure that quality was not compromised while only focusing on speed.
Negative Schedule Variance (SV < 0)
A negative SV indicates that the project is behind schedule. The team has completed less work than it originally planned, which may signal resource constraints, underestimated task complexity, scope changes, or other execution challenges. Negative variance requires immediate attention and corrective action planning.
Zero Schedule Variance (SV = 0)
When SV equals zero, the project is precisely on schedule. The value of work completed matches the planned value at this point in time. Even though this is the ideal position, regular monitoring is also significant as conditions may change rapidly.
Interpretation gives you direction.
Examples give you clarity.
Let’s break this down with real figures so you can see exactly how ahead, behind, and on-schedule situations are calculated.
Practical Examples of Schedule Variance Calculation
The following examples illustrate how schedule variance is calculated and interpreted in real-world project scenarios:
Example 1: Project Ahead of Schedule (Project Alpha)
A software development project has a total budget of $200,000 and is six months into a twelve-month timeline. According to the project plan, 50% of the work should be complete, setting the Planned Value at $100,000. The project team has actually completed work valued at $120,000 (EV).
Example 1 Calculation:
SV = $120,000 − $100,000 = +$20,000
SV = +$20,000
Interpretation: The project is $20,000 ahead of schedule. The team has delivered more value than was planned for this period, which is a positive performance indicator.
Example 2: Project Behind Schedule (Project Beta)
A construction project is planned to have $90,000 worth of work completed by the end of the third quarter. Due to material delays and adverse weather, only $75,000 worth of work has been completed (EV).
Example 2 Calculation:
SV = $75,000 − $90,000 = -$15,000
SV = -$15,000
Interpretation: The project is $15,000 behind schedule. This negative variance signals that corrective actions are required to get the project back on track.
Example 3: Project On Schedule (Project Gamma)
A marketing campaign was planned to have $50,000 worth of deliverables completed by the midpoint of the project timeline. The team has completed exactly $50,000 worth of work (EV).
Example 3 Calculation:
SV = $50,000 − $50,000 = $0
SV = $0
Interpretation: The project is exactly on schedule. While favorable, management should continue monitoring to maintain this performance trajectory.
Schedule Variance at a Glance
| Scenario | EV ($) | PV ($) | SV ($) | Interpretation |
|---|---|---|---|---|
| Project Alpha | $120,000 | $100,000 | +$20,000 | Ahead of Schedule |
| Project Beta | $75,000 | $90,000 | -$15,000 | Behind Schedule |
| Project Gamma | $50,000 | $50,000 | $0 | On Schedule |
Schedule Performance Index (SPI)
While schedule variance provides an absolute measure of schedule deviation, the schedule performance index (SPI) provides a relative measure of schedule efficiency. It is particularly useful when comparing performance across projects of different sizes.
Schedule Performance Index Formula (SPI)
SPI = EV ÷ PV
Interpretation of SPI values:
- SPI > 1.0: The project is ahead of schedule (efficient delivery)
- SPI = 1.0: The project is exactly on schedule
- SPI < 1.0: The project is behind schedule (inefficient delivery)
Using the figures from Example 1 (Project Alpha) above: SPI = $120,000 ÷ $100,000 = 1.20. This means the team is delivering 20% more value per unit of time than planned, a strong performance indicator.
What Are the Pros and Cons of the Schedule Variance Calculator?
A schedule variance calculator is a useful tool for determining if a project is on schedule or delayed. Being aware of the advantages as well as the disadvantages of this tool will allow you to better understand in which cases you can rely on its output and when to look deeper. Below is a brief overview of the advantages and disadvantages.
| Pros | Cons |
|---|---|
| Instantly shows whether a project is ahead or behind schedule. | Does not explain why a schedule variance occurred. |
| Helps you make faster, informed decisions. | It can be misleading if the project baseline was poorly planned. |
| Easy to use, even for those with limited project management experience. | Only measures time performance, not cost or quality. |
| Provides a clear numeric value that removes guesswork. | A negative variance does not always mean the project will fail. |
| Useful for spotting early warning signs before delays worsen. | Does not account for task dependencies or critical path impact. |
| Supports better communication with stakeholders using real data. | Results become meaningless without a well-defined project scope. |
What Your Schedule Variance Data Could Be Telling You?
Schedule variance gives you a number. But if you look closely, that number reveals much more than whether you are ahead or behind. When you track variance consistently, patterns begin to appear. Those patterns help you understand execution speed, planning accuracy, and delivery risks before they turn into bigger problems. Here’s what your schedule variance results might be showing you:
Spot Falling Behind Tasks
See which phases are missing planned progress, signaling poor time estimation.
Catch Scope Creep Early
A growing negative variance hints that unplanned work is quietly eating into your timeline.
Find Planning Weak Spots Fast
Repeated negative variance in the same areas shows where your estimates need revisiting.
Uncover Execution Bottlenecks
Tasks that keep slipping behind point to resource or workflow blockers slowing progress.
Identify High-Risk Project Phases
Patterns reveal which milestones or stages consistently struggle, helping you prioritize monitoring.
Forecast Project Completion Better
Consistent variance trends show whether your current deadline is realistic or needs adjusting.
How Time Champ Goes Beyond a Schedule Variance Calculator?
A schedule variance calculator shows whether you are ahead or behind. Time Champ takes it further by connecting that number to real project activity. Instead of viewing variance in isolation, you can track tasks, timelines, assigned resources, and actual progress in one place. This gives you a clearer understanding of why a schedule gap exists and what needs attention.
With built-in project tracking, workload visibility, and real-time progress monitoring, Time Champ helps you act on schedule data rather than just observe it. You can review milestone performance, identify delays early, adjust priorities, and keep delivery aligned with your original plan. It turns schedule variance from a static calculation into a practical decision-making advantage.
| Feature | Time Champ | Spreadsheets | Manual |
|---|---|---|---|
| Project Timeline Planning | ✓ | Manual Setup | ✕ |
| Task & Progress Tracking | ✓ | Manual Updates | ✕ |
| Earned Value & Planned Value Tracking | ✓ | Manual Formulas | ✕ |
| Schedule Variance Monitoring | ✓ | Limited | ✕ |
| Workload Balance Visibility | ✓ | Limited | ✕ |
| Capacity Planning Insights | ✓ | Manual Calculation | ✕ |
| Budget & Cost Tracking | ✓ | Manual Entry | ✕ |
| Sprint & Backlog Management | ✓ | Limited | ✕ |
| Timesheet Tracking | ✓ | Manual Input | ✕ |
| Automated Project Reports | ✓ | Manual Compilation | ✕ |
| Resource Allocation Overview | ✓ | Manual Tracking | ✕ |
| Historical Performance Analysis | ✓ | Manual Analysis | ✕ |
Move from manual schedule tracking to real-time project visibility.
Spot variances early, stay on schedule, and make smarter decisions with Time Champ!
- Live project progress tracking across tasks and milestones
- Real-time alerts when tasks fall behind planned progress
- Clear view of planned vs. actual progress at every stage
- Accurate project data ready for reporting in one place
- Detailed timeline insights to prevent deadline overruns
A Workforce Intelligence Tool Built for Smarter Performance
See What Our Happy Customers Say
We used Time Champ to bring structure and better clarity into our daily workflow. Our teams began to see where time was being spent, how tasks were progressing, and what required attention. That visibility helped us remain productive and maintain balance.
Time Champ reshaped the way we handled our daily operations. It simplified staff tracking and streamlined how we managed routine tasks. We experienced measurable gains in both productivity and accountability. I would recommend it to any business searching for a straightforward, all-in-one solution.
Time Champ provided the clarity we were looking for. Its features allowed us to understand work patterns in depth, while remaining easy to use, cost-effective, and flexible enough for teams of different sizes.
Understanding how our teams worked without constant follow-ups had been difficult. Time Champ brought immediate clarity to daily activities and delivered clear insights that supported better decision-making.
Managing remote teams became much easier. We gained clearer visibility into work habits, productivity levels, and attendance patterns. The custom reporting feature also helped us quickly identify areas that required attention.
Time Champ added a clear structure to our daily operations. Managing projects, tracking time, and handling attendance became much simpler. The platform is easy to use, and the support team stays responsive and helpful.
Connect with our product experts for a live demo and discuss your business requirements.
Explore Other Calculators
Project Cost Calculator
Calculate expenses with our project cost calculator, a tool for estimating budgets, tracking costs, and planning projects with accuracy and control.
Try Now →Absence Percentage Calculator
Calculate employee absence percentage easily with our absence percentage calculator - a fast, accurate tool for tracking attendance and workforce.
Try Now →Shift Differential Calculator
Calculate task or project completion rates instantly with our completion percentage calculator - an accurate tool to track progress and improve productivity.
Try Now →Ready to Manage Your Workforce Smarter?
Join our family of 1500+ companies using smart insights to redefine workforces!
Free Trial
No Credit Card Required