Workforce Analytics Report: Tips to Build Better Reports
Create a better workforce analytics report with key metrics, report types, and practical steps to improve workforce planning and business performance.
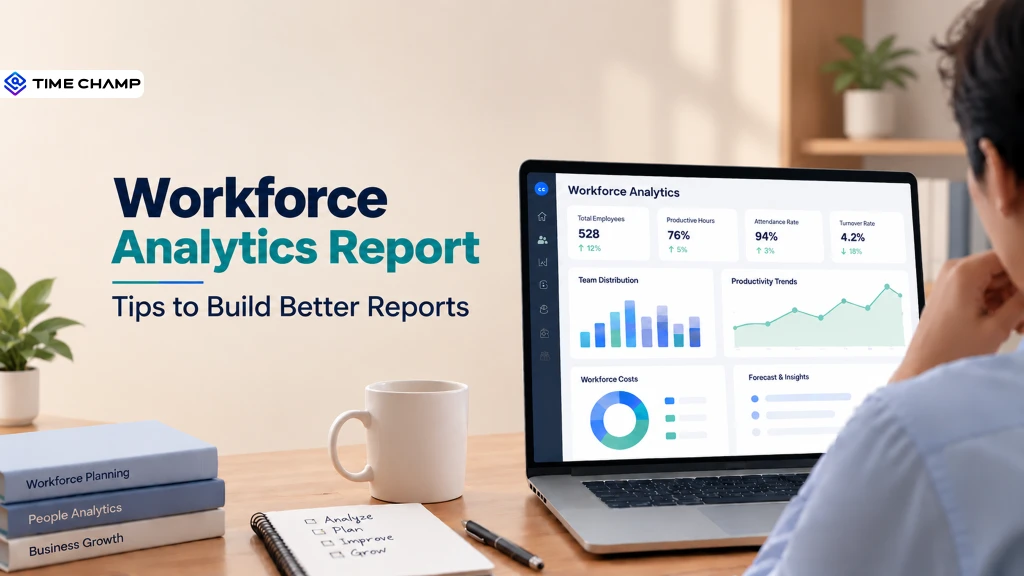
Ever feel like you’re surrounded by workforce data but still can’t get clear answers about what’s happening in your workforce? When information from time tracking, attendance, productivity, and performance sits in different places, it becomes hard to see patterns or plan resources effectively. A workforce analytics report brings these insights together, helping you identify workforce patterns and make informed decisions.
Here you'll learn what these reports include and why they matter. You’ll also find six practical steps to build better reports and common mistakes to avoid.
What Is a Workforce Analytics Report?
A workforce analytics report is a structured summary of workforce data that shows patterns in employee activity, productivity, attendance, performance, and resource use. It combines key workforce metrics into clear insights, helping you identify trends, evaluate workforce efficiency, spot gaps, and make better decisions about staffing, performance, and workforce planning.
What Does a Workforce Analytics Report Include? The 7 Core Sections
A well-structured workforce analytics report should give you more than a collection of numbers. It should organize key workforce information into clear sections, helping you spot changes, compare performance, and make better workforce decisions.

1. Workforce Snapshot
Start with a quick view of your current workforce. This section gives you the basic context needed to interpret the rest of the report.
- Workforce Size: Total active employees across the organization.
- Team Distribution: Workforce breakdown by department, role, location, or work model.
- Workforce Changes: New hires, exits, transfers, and headcount changes during the reporting period.
2. Hiring and Workforce Growth
This section shows how your workforce is growing and where hiring activity stands.
- Hiring Volume: Number of employees hired during a specific period.
- Hiring Efficiency: Average time and resources required to fill open positions.
- Workforce Growth: Changes in headcount across teams, roles, and locations.
- Staffing Gaps: Positions or teams that may need additional resources.
3. Retention and Employee Movement
Track workforce stability by looking at how employees enter, move through, and leave the organization.
- Turnover Rate: Percentage of employees who leave during a given period.
- Retention Trends: Changes in the number of employees who remain with the organization.
- Employee Movement: Internal transfers, promotions, and role changes.
- Departure Patterns: Turnover trends by department, role, location, or tenure.

Did You Know?
SHRM reports that 82% of organizations using people analytics identify retention and turnover as their primary use case. This highlights why retention and turnover metrics matter for spotting workforce stability trends and staffing risks early.
4. Productivity and Work Patterns
This section helps you assess how teams spend their working time and how productivity changes over time.
- Productive Hours: Time spent on active work and assigned tasks.
- Activity Patterns: Trends in active, break, and idle time.
- Task Performance: Completed tasks, projects, or assigned work.
- Productivity Trends: Changes in team or individual productivity across reporting periods.
5. Attendance and Workforce Availability
Attendance data helps you see whether your workforce has the availability needed to maintain smooth operations.
- Attendance Rate: Percentage of scheduled workdays completed.
- Absence Patterns: Trends in leave, absences, and missed workdays.
- Working Hours: Actual hours compared with scheduled hours.
- Overtime: Additional hours worked beyond regular schedules.
6. Workforce Costs and Resource Use
Connect workforce activity with the resources required to support your teams. This gives you a clearer view of where workforce spending is going.
- Labor Costs: Overall workforce expenses during the reporting period.
- Overtime Costs: Additional costs linked to extended working hours.
- Cost by Team: Workforce spending across departments or projects.
- Resource Utilization: How effectively available workforce capacity is being used.
7. Trends, Forecasts, and Key Insights
The final section should turn the collected data into useful takeaways. It helps you look beyond current performance and identify what may require attention next.
- Performance Trends: Significant changes across teams or reporting periods.
- Workforce Patterns: Recurring changes in attendance, productivity, workload, or staffing.
- Capacity Outlook: Potential workforce shortages or excess capacity.
- Key Recommendations: Practical actions based on the most important findings.
Finding it hard to turn workforce data into clear insights?
Time Champ brings workforce data together to simplify analysis and decisions.
How to Build a Workforce Analytics Report in 6 Steps
Build your workforce analytics report around a clear business need, not by filling it with every available workforce metric. Follow these six steps to organize reliable data, identify useful patterns, and turn your findings into practical actions.
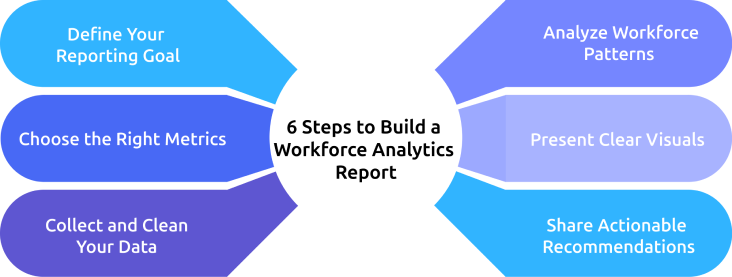
1. Define Your Reporting Goal
Start by deciding what you want the report to accomplish. Focus on one specific workforce problem, such as declining productivity, high overtime, or uneven workloads. Set a clear reporting goal that connects directly to a workforce or operational decision.
2. Choose the Right Metrics
Select metrics that directly support your reporting goal. Depending on your objective, you may track productivity, attendance, overtime, turnover, utilization, workload, or workforce costs. Keep the metric set focused so readers can quickly identify the information that matters.
3. Collect and Clean Your Data
Gather the required information from relevant HR, attendance, payroll, time tracking, and project systems. Check the data for missing, duplicate, or inconsistent records before using it. Then, organize the information by factors such as team, role, location, project, or reporting period.
4. Analyze Workforce Patterns
Compare your results across teams, departments, and reporting periods to identify meaningful changes. Look for trends in productivity, attendance, workload, turnover, or workforce costs. Investigate the factors behind significant increases, declines, or unusual patterns before concluding.
5. Present Clear Visuals
Turn your findings into simple charts, graphs, and tables that are easy to read. Highlight important changes, performance gaps, and emerging trends without overcrowding the report. Place the most important findings where decision-makers can quickly see and interpret them.
6. Share Actionable Recommendations
Finish the report by explaining what the findings mean and what should happen next. Recommend practical actions that address the issues identified in your analysis. Clearly define the next steps and review future reports to measure whether those actions improve workforce outcomes.
Did You Know?
According to the U.S. Bureau of Labor Statistics, nonfarm business labor productivity rose 2.5% from Q4 2024 to Q4 2025, highlighting the value of tracking productivity trends.
5 Common Workforce Analytics Reporting Mistakes to Avoid
A workforce analytics report can lose its value when the wrong metrics, poor-quality data, or unclear analysis influence the results. Avoid these five common mistakes to keep your reports accurate, focused, and useful for decision-making.
1. Tracking Too Many Metrics
Adding every available workforce metric can make your report difficult to read and act on. Focus on measures that directly support your reporting goal, such as productivity, attendance, utilization, turnover, or workforce costs. A smaller set of relevant metrics can provide clearer insights than a crowded report.
2. Relying on Inaccurate or Incomplete Data
Poor quality data can lead to misleading workforce insights. Missing records, duplicate entries, outdated employee information, and inconsistent metric definitions can affect your results. Validate your data before building the report and maintain consistent definitions across reporting periods.
3. Reporting Numbers Without Context
A metric rarely tells the full story on its own. For example, a rise in overtime does not automatically mean employees are less productive. Compare results across teams, time periods, workloads, and business conditions to identify what may be driving the change.
4. Confusing Correlation with Causation
Two workforce trends can change simultaneously without one causing the other. Avoid making conclusions based only on a visible relationship between metrics. Check other relevant factors and combine quantitative findings with additional workforce information before deciding what caused a trend.
5. Creating Reports Without Actionable Insights
A report should do more than show that a metric increased or decreased. Explain what the change means, why it matters, and what action could address it. Connect important findings to specific decisions so you can use the report to improve workforce planning, productivity, or resource allocation.
How Time Champ Automatically Generates Workforce Analytics Reports
Creating workforce analytics reports manually can take significant time, especially when data comes from different systems. You may also struggle to keep reports updated while tracking productivity, attendance, work patterns, and performance. Time Champ is a smart employee monitoring tool with built-in workforce analytics features that automatically capture workforce data, analyze key patterns, and generate detailed reports, giving you timely insights without relying on manual reporting.
Here are the key Time Champ workforce analytics capabilities that improve productivity, performance, and decisions.
- Actionable Workforce Insights: Provides clear workforce metrics and performance insights, helping you make faster and more informed operational decisions.
- Automated Workforce Data Capture: Automatically captures activity, time, and attendance data, helping you eliminate manual tracking and reduce reporting effort.
- Productivity and Efficiency Trends: Tracks productivity over time and compares team efficiency trends, helping you quickly identify performance gaps and improvement areas.
- Workload and Behavioral Pattern Analysis: Analyzes workload distribution and work behavior patterns, helping you balance workloads and improve workforce well-being.
- Detailed Workforce Reports: Generates detailed reports on productivity, attendance, activity, and performance, helping you simplify analysis, decisions, and compliance.
- Real-Time Dashboards and Visual Insights: Offers real-time dashboards with visual insights like timelines and heat maps, helping you instantly spot workforce changes and trends.
Struggling with manual workforce reporting?
Time Champ automatically generates workforce analytics reports for faster insights.
Conclusion
A workforce analytics report helps you turn scattered workforce data into clear insights and practical decisions. Choosing relevant metrics, using reliable data, analyzing trends, and presenting findings clearly can help you identify productivity gaps, workload issues, attendance patterns, and workforce needs. Avoiding common reporting mistakes also keeps your insights accurate and useful. Start by defining the business question you need to answer, then build your report around metrics that support that goal. Review your findings regularly and turn important insights into specific actions. With the right approach, workforce analytics can help you improve workforce planning, strengthen performance, and make better decisions with confidence.

Anjali

Table of Content
 What Is a Workforce Analytics Report?
- What Does a Workforce Analytics Report Include? The 7 Core Sections
- How to Build a Workforce Analytics Report in 6 Steps
- 5 Common Workforce Analytics Reporting Mistakes to Avoid
- How Time Champ Automatically Generates Workforce Analytics Reports
- Conclusion
Related Blogs
![What is Workforce Intelligence? A Complete Guide [2026]](https://www.timechamp.io/images/workforce-intelligence-feature-image.webp)
Discover what workforce intelligence is, why it's critical, real examples, implementation steps, key benefits, challenges & how AI transforms the future.
Guna Lakshmi | Feb 11, 2026
Discover how workforce intelligence improves workload distribution, balances team capacity, prevents burnout & how to manage it with data effectively.
Tarun Kumar | Feb 11, 2026
Discover 10 workforce planning models every HR professional should know to align talent with business goals, improve efficiency, and plan for the future.
Thasleem Shaik | September 30, 2025
Learn what productivity intelligence is, why it
Shabana Shaik | Feb 11, 2026
Understand what employee performance tracking is, along with proven methods, metrics that matter, and the best tools to track performance fairly in 2026.
Shabana Shaik | Jul 15, 2026
Learn why workforce analytics drives business value, how to measure ROI with formulas, strategies for measurable returns, challenges, & business impact.
Thasleem Shaik | Feb 11, 2026


 4.7/5 avg.
Ready to Manage Your Workforce Smarter?
Join our family of 1500+ companies using smart insights to redefine workforces!

Free Trial
No Credit Card Required