What is Utilization Rate? Definition, Formula & Calculation
Evaluating staff performance and project productivity is vital for all organizations. One of the best metrics to determine both is the utilization rate (measures how much of an employee's available working time is spent on productive or billable work).
No matter if you are a consultant, marketer, or IT company, knowing the employee utilization rate is crucial for capacity planning, increasing profits, and avoiding employee burnout. This blog will explain what utilization rate is, why it matters, how to calculate it, what the industry averages and benchmarks are, and how employee utilization reports can help you make better decisions.
SPI Research states that best-in-class service-based companies typically report billable utilization rates above 75%, hence, why this is a common average across many industries.
What Is Utilization Rate?
Utilization rate refers to the proportion of an employee's available working hours that are rounded to billable, or revenue-generating work. It helps determine how efficiently the time and resources of the firm are utilized.
Understanding Its Purpose
The main intention of tracking the utilization rate is to know how efficiently time is used. If the employee is available for 40 hours a week and is only engaged in client-related work for 20 hours, and the remaining time is non-billable, then that's not a good combination. The non-billable work (such as training, administration work, meetings, etc.) is certainly necessary, but if you can note a trend toward improving the utilization rate, you will no doubt demonstrate a more efficient consideration of resource management, as detected by how much time is being used by the employee.
The utilization rate also assesses employees who have a low utilization rate, and employees with too high utilization rate. If the utilization rate for an employee is consistently low, it suggests some lost opportunity. Yet on the flip side, if the utilization rate for the employee is consistently high, it could suggest that the employee is busy to the point of being too stretched, eventually leading to burnout and/or stress.
Utilization rate helps you with project planning, resource allocation considerations, with performance considerations as well. Businesses use utilization data to adjust workloads, improve profitability, and ensure sustainable employee engagement.
Lastly, companies can forecast project timeliness and profitability more accurately when utilization is measured and optimized.
Why Is Utilization Rate Important for Businesses?
The utilization rate is more than a number, it’s a performance indicator tied directly to productivity, project delivery, and profitability. Here's why it matters:
- Improves Resource Planning: It helps allocate work based on actual capacity, avoiding both under- and over-utilization.
- Increases Profitability: A higher employee utilization rate often leads to better use of billable time and increased revenue.
- Fosters Employee Well-being: Monitoring utilization facilitates keeping employees from being either overworked or underutilized.
- Improves Forecasting: It enables businesses to have a better idea of timelines, the number of employees, and projected capacity.
- Supports Better Decision-Making: With utilization insights in hand, decisions regarding hiring, growth, and project prioritization will be improved.
PwC suggests businesses that manage employee utilization get as much as 18% more productivity overall
How to Calculate Utilization Rate
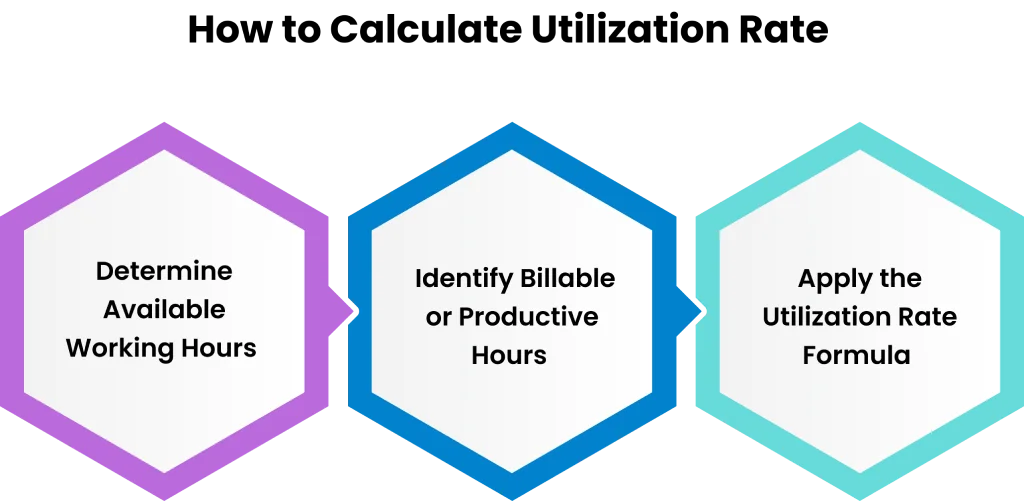
It is easy to calculate the utilization rate, but you need to be accurate with this. It is a simple three-step process to calculate your utilization rate.
Step 1: Determine Available Working Hours
First, you need to find the total number of hours that employee would be available in the time period you are going for (weekly, monthly, annually, etc.), usually around 40 hours per week for full time.
Step 2: Identify Billable or Productive Hours
Second, account for how many of those hours were directly spent on productive or billable work (i.e., client deliverables, development, design).
Step 3: Apply the Utilization Rate Formula
Finally, use the formula:
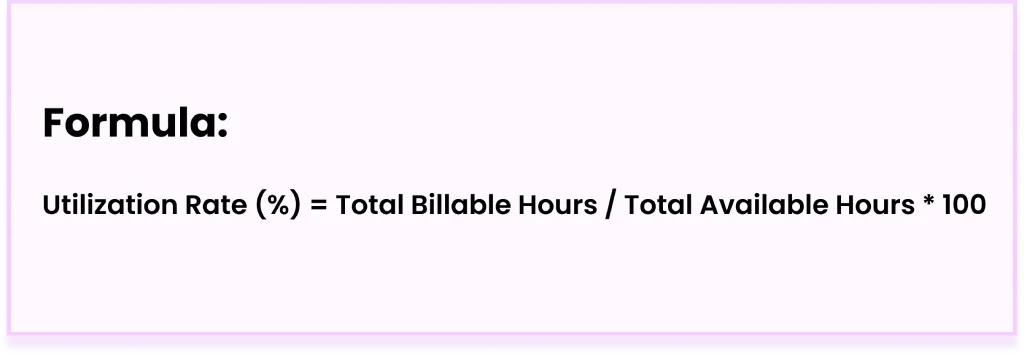
Utilization Rate (%) = Total Billable Hours / Total Available Hours * 100
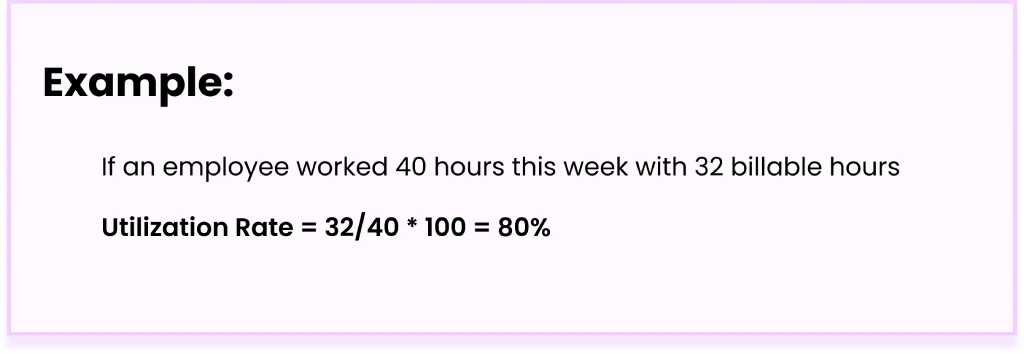
EXAMPLE
If an employee worked 40 hours this week with 32 billable hours:
Utilization Rate = 32/40 * 100 = 80%
This means they utilized 80% of their available time on billable productive work.
What is a Good Employee Utilization Rate?
There’s no one-size-fits-all benchmark, but a few industry standards help provide direction.
- Consulting and Agencies: A good utilization rate is recognized as 75-85%.
- IT and Software Development: It is usually in the range of 70-80%, depending on the team structure.
- Administrative or Support Teams: May be on the lower end if not lower than 50-60% due to the nature of their non-billable work.
Achieving 100% utilization is generally impossible and usually not very sustainable either. People require time for learning, collaborating, planning, and resting. For those services-based markets across the board, an occupancy range of between 75-85% is generally considered healthy.
How to Improve Employee Utilization Rate
Employee utilization rates can be improved but need to be appropriately balanced between pushing employees to productive limits rather than jeopardizing their overall wellness. Here are some simple tactics to explore:
1. Assign the Right Work to the Right People
When assigning work, ensure that your people are aligned with that work and their existing strengths and job functions. This will help limit lost time in moving up learning/return curves.
2. Use Time Tracking Tools
Time-tracking applications can help track billable and non-billable time, in real time, so that a manager or project manager can intervene if utilization drops compared to normal/acceptable utilization rate.
3. Minimize Unnecessary Meetings
Internal meetings can chew up precious productive hours. Include only those team members that require to be at the meeting and put a limit on meeting time.
4. Provide Skills Training
When employees gain skills, they are able to do a wider variety of tasks, therefore enhancing flexibility and utilization among teams.
5. Automate Repetitive Tasks
Automation gives employees the opportunity to escape low-value work, allowing them to leverage their time and effort on more impactful work.
6. Cross-Train Team Members
When employees are cross trained, they can fill in for their team members when workload peaks occur collaboratively without burdening the team individually, helping the team achieve optimized utilization.
What Should Be Included in an Employee Utilization Report?
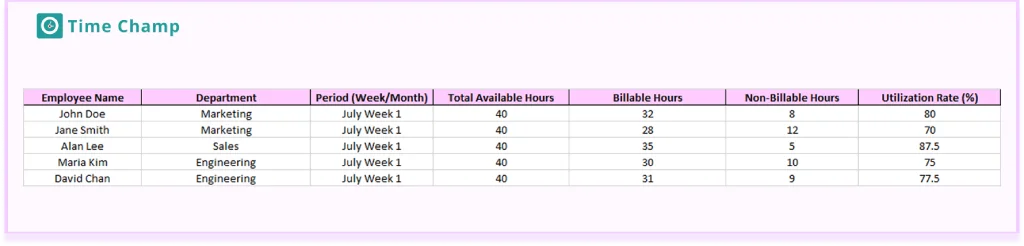
An employee utilization report could furnish managers with the data they need to make informed decisions. A utilization report will contain:
1. Total Available Hours
The total number of work hours available to each employee in the specified reporting period.
2. Billable/Project Hours
This would reflect the actual hours on billable tasks (actual hours that are considered direct effort on any task that results in a deliverable to the client or project that is internal).
3. Non-Billable Time
Time spent in meetings, training, admin work, and any hours of inactivity.
4. Utilization Rate (%)
Formula: (Billable Hours ÷ Total Available Hours) × 100
This shows how much of an employee's time is spent on billable work. For example, 30 billable hours out of 40 total hours equals a 75% utilization rate. It helps to track productivity and efficiency.
5. Departmental Averages
Information that can be used to compare other departments' high-performance teams versus low-performance teams.
6. Trends Over Time
Utilization may be considered during weeks, months, or yearly periods; this will be maintaining records to identify movement or trends.
Monitoring this often would provide the insight required to identify an issue with utilization and make changes to mitigate it before other issues arise. These reports offer insight into where time is being well spent and where improvements are needed.
What Is the Difference Between Utilization Rate and Billable Rate?
Although often used interchangeably, these two metrics have different meanings:
| Metric | Utilization Rate | Utilization Rate |
|---|
Understanding the difference between utilization rate and billable rate helps companies not only manage workloads but also ensure accurate billing and profitability tracking

Track Every Hour, Effortlessly
Automatic time tracking across apps, sites, and projects.
Explore Time Tracking →Productivity Starts With Visibility - Time Champ Gives You Both!
Book Your Free Demo