25 Employee KPI Metrics for Performance Evaluation
Browse 25 KPI examples for employees by category and role, including formulas, target benchmarks, practical examples, and metrics that can quietly backfire.

KPI Examples for Employees: 25 Metrics That Matter
Employee performance is easy to talk about but surprisingly difficult to measure. Many organizations depend on broad assessments like "good attitude" or "strong work ethic," yet these observations rarely provide the clarity needed to improve performance, reward top contributors, or align employees with business goals.
That's where Key Performance Indicators (KPIs) come in. But not all metrics are created equal. Some KPIs drive accountability and growth, while others encourage wrong behaviors, distort priorities, or create unnecessary pressure.
In this blog, you'll find 25 KPI examples for employees across different categories and roles. I'll break down each metric with formulas, target benchmarks, and practical use cases so you can understand what it measures and when to use it.
What Are KPIs for Employees?
KPIs (Key Performance Indicators) are measurable values that show how effectively an employee is contributing to key job responsibilities and business goals. A good KPI is tied to a meaningful outcome, has a clear target, and can be tracked over time so both managers and employees can measure progress objectively.
One common mistake is using the terms KPI, metric, and goal interchangeably. They're related, but they serve different purposes:
| Term | What It Is | Example |
|---|---|---|
| Metric | Any measurable number related to work | Emails sent this week |
| KPI | A metric tied to a business outcome and target | First-response time under 2 hours |
| Goal | The outcome the KPI helps achieve | Faster, more satisfying customer support |
Every KPI is a metric, but not every metric is a KPI. "Emails sent" measures activity, but it doesn't necessarily indicate success. "First-response time" is a KPI because it directly supports a goal that matters to the business and the customer.
Keeping this distinction in mind will make it much easier to choose employee KPIs that drive results instead of simply tracking activity.
Why Do Employee KPIs Actually Matter?
Employee KPIs help you turn vague expectations into measurable outcomes. Instead of depending on subjective opinions, you can evaluate performance using clear, consistent criteria that align with business goals.
Good KPIs help you:
- Set clear performance expectations for employees
- Align individual work with team and company objectives
- Find performance issues before they become bigger problems
- Run more objective and productive performance reviews
- Recognize and reward top performers fairly
- Coach employees using data instead of assumptions
- Improve accountability across your team
When your employees can see the scoreboard, they're more likely to focus on the results that matter most.
The 5 Categories Every Employee KPI Falls Into
Most employee KPIs fall into one of five categories. If you track at least one KPI from each category, you'll get a more balanced view of performance instead of rewarding one dimension.
Think of this framework as a shortcut for choosing better KPIs. Once you understand these five categories, you can build meaningful performance metrics for almost any role on your team.
| Category | What It Answers | Watch Out For |
|---|---|---|
| Output | How much is getting done? | Rewarding volume over value |
| Quality | How good is the work? | Easy to overlook because it's harder to measure |
| Efficiency | How well are time and effort used? | Turning measurement into surveillance |
| Impact | Did the work contribute to a meaningful goal? | Results can take time to appear |
| Behavior | How does the employee work with others? | Subjective or biased evaluations |
As you review the KPI examples below, notice which category each metric belongs to. The strongest performance scorecards combine multiple categories rather than depending on just one.
25 KPI Examples for Employees (by Category)
Here are 25 employee KPI examples, organized into the five categories mentioned above. Each KPI includes a simple formula and a practical starting target to help you measure performance effectively.
Keep in mind that these benchmarks are intended as general guidelines, not fixed standards. The most appropriate targets will depend on factors such as your industry, team structure, business objectives, and overall performance expectations.
Output KPIs
| KPI | How to Measure It | Sensible Target |
|---|---|---|
| Task completion rate | Tasks completed ÷ tasks assigned | 85–95% |
| Output volume | Units produced per day or week | Role-specific baseline |
| On-time delivery rate | On-time tasks ÷ total tasks | 90%+ |
| Utilization rate | Productive hours ÷ available hours | 70–85% |
| Throughput | Items moved to done per sprint | Stable or rising trend |
Quality KPIs
| KPI | How to Measure It | Sensible Target |
|---|---|---|
| Error or defect rate | Errors ÷ total output | Under 2% |
| Rework rate | Tasks reopened ÷ tasks completed | Under 5% |
| First-time-right rate | Work accepted without revision ÷ total work submitted | 85%+ |
| Customer satisfaction (CSAT) | Positive ratings ÷ total ratings | 90%+ |
| Quality audit score | Average score from quality reviews or audits | 4 out of 5 or higher |
Efficiency & KPIs
| KPI | How to Measure It | Sensible Target |
|---|---|---|
| Average handling time | Total time spent ÷ tasks handled | Decreasing over time |
| Cycle time | Time from start to completion of a task | Shorter and consistent |
| Planned vs actual time | Actual hours ÷ estimated hours | Close to 1.0 |
| Idle time ratio | Inactive time ÷ logged time | Low (role-dependent) |
Impact KPIs
| KPI | How to Measure It | Sensible Target |
|---|---|---|
| Goal attainment | Goals met ÷ goals set | 70–90% |
| Revenue or pipeline contribution | Revenue or pipeline value tied to individual work | Role-based quota or share |
| Cost savings delivered | Money saved through employee initiatives | Role-specific |
| Project ROI contribution | Value delivered ÷ effort spent | Positive trend |
| Conversion rate | Wins ÷ opportunities handled | Benchmark by role |
Behavior, Collaboration & Engagement KPIs
| KPI | How to Measure It | Sensible Target |
|---|---|---|
| Peer feedback score | Average rating from 360° feedback | 4 out of 5 or higher |
| Meeting/commitment reliability | Commitments kept ÷ commitments made | 90%+ |
| Knowledge sharing | Docs created, reviews completed, or help contributions logged | Active participation (not zero) |
| Learning completion | Training completed ÷ training assigned | 100% for mandatory training |
| Initiative count | Improvements or suggestions proposed per quarter | At least one |
| Absenteeism rate | Unplanned days off ÷ working days | Under 3% |
KPI Examples for Employees by Role
The best KPIs vary by role. Below is a simple starting set for common functions, with four KPIs per role.
| Role | Four KPIs to Start With |
|---|---|
| Sales | Quota attainment, win rate, average deal size, pipeline coverage |
| Customer support | First-response time, CSAT, first-contact resolution, ticket backlog |
| Marketing | Qualified leads, cost per lead, content engagement, pipeline influenced |
| Software engineering | On-time delivery, defect rate, cycle time, code review turnaround |
| HR / People | Time-to-hire, offer acceptance rate, retention rate, eNPS |
| Operations / Admin | Task completion rate, error rate, SLA adherence, cost per task |
| Finance | Reporting accuracy, days to close, forecast variance, on-time filings |
Notice the balance across roles: each set mixes output, quality, and impact, ensuring performance isn’t driven by speed alone.
Use these as a starting point, then adjust targets based on your organization’s benchmarks.
Run reviews on data, not assumptions.
Give every KPI a reliable data source and every decision a stronger foundation.
KPIs That Backfire: 5 Examples Managers Get Wrong
Some KPIs can look productive on the surface but unintentionally encourage the wrong behavior. The answer usually isn’t to remove the metric, but to balance it with a counter-KPI so that one number can’t be “gamed” at the expense of the other.
1. Hours Logged
Why it backfires: Rewards appear busy rather than deliver results. People stretch tasks or stay online longer than necessary.
Fix: Pair with output-based KPIs, such as task completion rate or on-time delivery.
2. Tickets Closed
Why it backfires: Encourages rushing or splitting issues into smaller tickets to inflate numbers.
Fix: Pair with first-contact resolution and CSAT to ensure quality stays high.
3. Lines of Code
Why it backfires: More code does not mean better software. It rewards complexity instead of efficiency.
Fix: Pair with defect rate and cycle time to focus on clean, working delivery.
4. Calls Made
Why it backfires: Encourages dialing low-quality leads just to hit targets.
Fix: Pair with conversion rate or qualified meetings booked to measure real impact.
5. Number of Meetings Attended
Why it backfires: Treats presence as productivity. People attend more meetings but contribute less real work.
Fix: Pair with goal attainment or commitments delivered.
The rule is simple: activity-based KPIs must be paired with outcome-based ones. Volume needs value, speed needs quality. When you balance both, you can eliminate the easy loopholes and make performance measurement more meaningful.
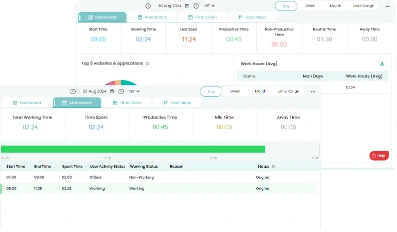
How Time Champ Makes Employee KPI Tracking Easier
Time Champ is an employee monitoring software that helps you track the data behind employee KPIs automatically. It captures work activity, time usage, and productivity insights in the background, and it gives you a more reliable foundation for measuring performance.
Time Champ helps solve this by automatically recording the inputs behind many common employee KPIs. Instead of asking employees to manually log every activity, you get visibility into how work is performed across tasks, applications, and work hours.
Here’s how Time Champ supports:
- Automatic time tracking provides data for utilization rate, planned vs. actual time, cycle time, and on-time delivery.
- Productivity tracking helps measure output and efficiency by analyzing application and website usage.
- Idle time detection gives you a more accurate view of idle-time ratio and work patterns.
- Workload visibility helps identify overloaded team members before missed deadlines or burnout become a problem.
- Real-time dashboards allow you to monitor KPI trends continuously instead of waiting for monthly or quarterly reviews.
The goal is not to create more metrics, it’s to make existing KPIs more accurate and easier to track. When you and your employees work from the same data, performance conversations become more objective, and coaching becomes more effective.
Ready to Track Employee KPIs More Effectively?
See how Time Champ helps you measure employee performance, find productivity trends, and turn insights into action.
Conclusion
The right KPIs help you move beyond guesswork and measure what truly drives performance. Focus on metrics that align with business goals, balance activity with outcomes, and provide employees with clear expectations. Start with a few meaningful KPIs, refine them over time, and use the insights to support improvement, not just evaluation.

Jahnavi Pulluri
Table of Content
 KPI Examples for Employees: 25 Metrics That Matter
- What Are KPIs for Employees?
- Why Do Employee KPIs Actually Matter?
- The 5 Categories Every Employee KPI Falls Into
- 25 KPI Examples for Employees (by Category)
- KPI Examples for Employees by Role
- KPIs That Backfire: 5 Examples Managers Get Wrong
- How Time Champ Makes Employee KPI Tracking Easier
- Conclusion
Related Blogs
Learn how low productivity affects your business and discover proven strategies to improve efficiency, employee morale, and overall performance.
Thasleem Shaik | Jan 08, 2025
Find out how PC monitoring software helps businesses overcome 7 major productivity barriers by improving accountability, workflow visibility, and security.
Jahnavi Pulluri | May 08, 2026
12 proven methods to improve employee productivity. Diagnose your biggest time leak first, then fix it with clarity, trust, focus, and the right tools.
Shabana Shaik | Jun 18, 2026
Think about going to a workplace where people are full of energy. People look at their peers with warm smiles, people do not hesitate to share their ideas
Thasleem Shaik | Jun 27, 2024
A productivity report shows how work really happened. Learn the metrics, types and formats to include, how to build one, and how to read it the right way.
Shabana Shaik | Jun 11, 2026Ready to Manage Your Workforce Smarter?
Join our family of 1100+ companies using smart insights to redefine workforces!
Free Trial
No Credit Card Required