Workflow Efficiency Metrics: What to Measure & Benchmarks
Learn workflow efficiency, the 8 key metrics, formulas, benchmarks, and proven strategies to measure performance and improve your team's productivity.
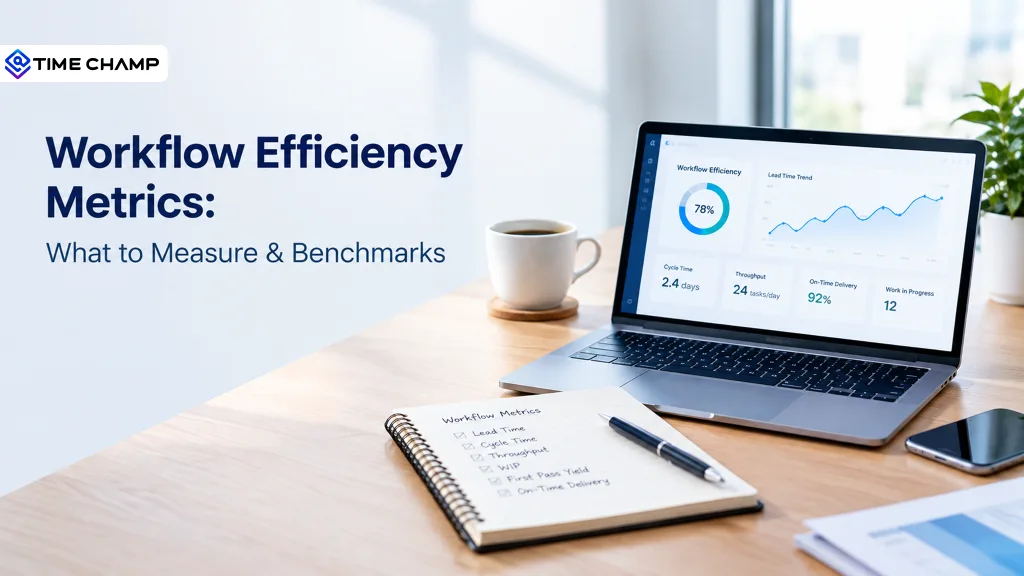
A process that should take a few hours can easily stretch into days. The work isn't always the problem; approvals, handoffs, waiting for feedback, and rework often add more time than the task itself.
According to Asana's Anatomy of Work Global Index2023, knowledge workers spend 58% of their day on "work about work" instead of creating value. Measuring where that time goes is the first step toward improving productivity.
This blog covers what workflow efficiency means, the eight metrics used to measure it, the formulas behind each one, realistic benchmarks, and ways to improve your results.
What is Workflow Efficiency?
Workflow efficiency is the percentage of a process's total time that is spent on value-added work instead of waiting, approvals, rework, or other delays. It measures how efficiently work moves from request to completion.
A higher workflow efficiency means more time is spent creating value, and less time is lost to inefficiencies. A lower score indicates that work is spending too much time waiting rather than progressing.
You may also see this metric referred to as flow efficiency or process cycle efficiency (PCE). Although the names differ, they all use the same calculation:
Workflow Efficiency (%) = (Value-Added Time ÷ Lead Time) × 100
The 8 Workflow Efficiency Metrics Worth Tracking
The eight metrics below provide a complete view of workflow performance, from speed and quality to workload and reliability.
| Metric | What It Measures | Formula |
|---|---|---|
| Lead time | Total time from request to delivery | Delivery Date − Request Date |
| Cycle time | Time spent actively working | Completion Time − Work Start Time |
| Workflow efficiency | Percentage of time spent on value-added work | (Value-Added Time ÷ Lead Time) × 100 |
| Throughput | Completed work over a period | Completed Items ÷ Time Period |
| Work in Progress (WIP) | Number of active tasks | Count of Started but Unfinished Items |
| First-pass yield | Work completed without rework | Items with No Rework ÷ Total Items) × 100 |
| Resource utilization | Productive capacity used | Productive Hours ÷ Available Hours) × 100 |
| On-time delivery | Work delivered by the promised date | (On-Time Deliveries ÷ Total Deliveries) × 100 |
1. Lead Time
Lead time measures the total time from when a request is made until it is delivered. It reflects the customer's waiting time, including both active work and delays.
Track the median lead time instead of the average, as a few unusually long projects can skew the results. Pair it with the 85th percentile to set realistic delivery expectations rather than optimistic ones.
2. Cycle Time
Cycle time measures how long it takes to complete work after it has started. Unlike lead time, it excludes the waiting period before work begins.
Measure cycle time for each stage of your workflow. This makes it easier to identify whether delays come from the work itself or from reviews, approvals, or handoffs between teams.
3. Workflow efficiency (Process Cycle Efficiency)
Workflow efficiency shows what percentage of the total lead time is spent on value-added work. It highlights how much time is lost to waiting, rework, or unnecessary delays.
Track this metric at the process level each month. A sudden drop often signals that an inefficiency or queue has formed somewhere in the workflow.
4. Throughput
Throughput measures how many tasks, requests, or projects are completed within a specific period.
Count only completed work and use the same unit of measurement every time. Consistent tracking makes it easier to identify trends and understand whether your team's delivery capacity is improving.
5. Work in Progress (WIP)
Work in Progress (WIP) is the number of tasks that have started but are not yet complete. High WIP usually means work is spread too thin, increasing waiting time across the process.
According to Little's Law:
Work in Progress = Throughput × Lead Time
or
Lead Time = Work in Progress ÷ Throughput
When throughput stays the same, reducing WIP usually shortens lead time. Limiting the number of active tasks is often one of the fastest ways to improve workflow efficiency.
6. First-Pass Yield
First-pass yield measures the percentage of work completed correctly on the first attempt without requiring rework.
A high first-pass yield indicates a reliable process, while a low score suggests quality issues that create extra work and increase lead times.
7. Resource Utilization
Resource utilization compares productive hours with the team's available working hours.
Although high utilization may seem desirable, consistently operating near 100% capacity often creates longer queues and slower delivery. Many teams perform better when utilization stays around 70–80%, leaving enough capacity to handle unexpected work.
8. On-Time Delivery
On-time delivery measures the percentage of work completed by the promised deadline.
Always compare performance against the original commitment date. Tracking this metric consistently helps measure delivery reliability and builds trust with customers and stakeholders.
Every Efficient Workflow Starts with Visibility!
See where time is spent, identify delays, and improve the way work moves across your team
Understanding Workflow Efficiency Benchmarks
One of the most common questions about workflow efficiency is, "What's a good score?" The answer depends on the type of work you're measuring. A manufacturing line, an accounts payable process, and a creative design team all have very different workflows, so their efficiency benchmarks differ too.
The table below shows typical and world-class process cycle efficiency (workflow efficiency) benchmarks based on Lean research.
| Process Type | Typical Efficiency | World-Class Efficiency |
|---|---|---|
| Machining | 1% | 20% |
| Fabrication | 10% | 25% |
| Assembly | 15% | 35% |
| Continuous process | 30% | 80% |
| Transactional (approvals, billing, support) | 10% | 50% |
| Creative (design, content, engineering) | 5% | 25% |
These benchmarks are often lower than expected. A 10% workflow efficiency for transactional work or 5% for creative work is considered typical because much of the elapsed time is spent waiting for approvals, reviews, and handoffs. Rather than aiming for 100% efficiency, focus on reducing delays and making steady improvements over time.
How to Improve Workflow Efficiency
Once you've measured your workflow efficiency, the next step is reducing the delays that slow work down. Focus on the inefficiencies first instead of trying to optimize every part of the process.
1. Reduce Queue Time Before Work Time
Most delays happen while work is waiting. Identify the stages where tasks spend the most time in queues, approvals, or reviews, and remove those delays before trying to speed up execution.
2. Limit Work in Progress (WIP)
The more tasks your team works on simultaneously, the longer each one takes to finish. Set work-in-progress limits for individuals or workflow stages so teams can complete work before starting new tasks.
3. Remove Unnecessary Handoffs and Approvals
Every handoff introduces waiting time and increases the risk of miscommunication. Review your approval process regularly and remove steps that rarely affect the final decision.
4. Minimize Context Switching
Constantly switching between tasks, meetings, and applications reduces focus and slows progress. Encourage dedicated focus time, batch similar work together, and limit unnecessary tool switching to help teams complete tasks more efficiently.
5. Standardize Before You Automate
Automation improves efficiency only when the underlying process is consistent. Document your workflow, eliminate unnecessary variations, and simplify repetitive steps before introducing automation tools.
6. Track the Right Metrics Consistently
Review lead time, cycle time, throughput, and work in progress every week to find inefficiencies early. Monitor workflow efficiency, first-pass yield, and on-time delivery monthly to measure long-term progress and identify areas for improvement.
How Time Champ Supports Workflow Measurement
Accurate workflow metrics depend on accurate time data. While project management tools show where work is in the process, they don't always capture how much time is actually spent on value-added work. Time Champ fills that gap with automated time tracking and workforce insights.
Automatic Time Tracking
Time Champ automatically records time spent on projects and tasks, eliminating manual timesheets. This provides a reliable measure of value-added time, making workflow efficiency calculations more accurate.
Measure Productive Work
Activity insights and idle time detection help distinguish productive work from inactive time. This gives teams a clearer understanding of where time is being spent and where productivity is being lost.
Identify Workflow Inefficiencies
Project and task-level reports show how time is distributed across different stages of a workflow. This makes it easier to identify delays and processes that need improvement.
Monitor Workload and Utilization
Resource utilization reports help you understand team capacity and balance workloads before they become issues. This helps prevent overloading individuals while improving overall workflow performance.
Better Workflows Begin with Better Insights!
Monitor workflow performance, balance workloads, and make every process faster and more efficient
Conclusion
Workflow efficiency is about reducing delays. The right metrics help you understand where work slows down and where improvements will have the biggest impact. Start with a baseline, fix one bottleneck at a time, and track your progress regularly. Small, consistent improvements can make your workflows faster, more reliable, and more productive over time.

Jahnavi Pulluri

Table of Content
 What is Workflow Efficiency?
- The 8 Workflow Efficiency Metrics Worth Tracking
- Understanding Workflow Efficiency Benchmarks
- How to Improve Workflow Efficiency
- How Time Champ Supports Workflow Measurement
- Conclusion
Related Blogs

Learn what workflow automation is, why it’s important, its types, examples, benefits, challenges, and how it differs from business process automation.
Anjali | Apr 08, 2026
Find the 11 best workflow automation software for 2026. Compare features, pricing, pros & cons to automate tasks and improve team efficiency.
Guna Lakshmi | Apr 08, 2026
Learn about time management for employees, its challenges, and effective tips to improve productivity, work efficiency, and overall workplace performance.
Jahnavi Pulluri | May 21, 2026
Learn how to build a time management plan that aligns roles, goals, and schedules. A practical, step-by-step guide to lead your team with clarity.
Thasleem Shaik | May 25, 2026
Compare the 10 best time management apps for 2026, with free plans, pricing, and what each tool is best for, so you can pick the right one for your team fast.
Guna Lakshmi | May 26, 2026
Stop wasting time on low-value tasks. Use the time management matrix to prioritize work, compare the Eisenhower and Covey time methods, and avoid mistakes.
Anjali | Jun 26, 2026


 4.7/5 avg.
Ready to Manage Your Workforce Smarter?
Join our family of 1500+ companies using smart insights to redefine workforces!

Free Trial
No Credit Card Required