Employee Engagement and Productivity: What the Data Shows
Explore how employee engagement impacts productivity with real data insights, trends, and what teams should focus on to improve performance.

Employee engagement and productivity often come up together, but the connection does not always lead to clear action. The link between them is widely known, yet daily work continues without clarity on what actually drives results. Effort goes in, activity stays high, but outcomes do not always improve.
The real challenge is understanding how work patterns connect to output. Without that clarity, decisions rely on assumptions instead of clear data. This makes it harder to spot issues early and improve performance consistently. This guide explains what the data shows, how engagement affects productivity in daily work, and what actions help improve both in a practical and measurable way.
What the Research Actually Says About Employee Engagement and Productivity?
Employee engagement reflects how strongly someone connects with their work, the team, and the goals they work toward. It goes beyond basic job satisfaction. A satisfied employee may feel comfortable with the role, while an engaged employee stays involved in the work and focuses on results that move the team forward.
Gallup has measured global engagement annually since 2009, and the most recent data tells a clear story. According to Gallup's 2026 State of the Global Workplace report, only 21% of employees worldwide are engaged at work. 62% are not engaged, meaning they show up and do the minimum. 15% are actively disengaged, meaning they undermine the work being done. The cost of this disengagement reaches $10 trillion globally, or roughly 9% of global GDP.
Why is the Correlation Consistent Across Studies
Multiple independent meta-analyses have replicated the engagement-productivity link across decades, industries, and geographies. The numbers are remarkably consistent. Highly engaged business units show 18% higher productivity, 23% higher profitability, and 78% lower absenteeism than the bottom quartile. When the same correlation appears in healthcare, manufacturing, software, and retail, the relationship is structural, not accidental.
Why Correlation Is Not the Same as Causation
High-performing teams may seem more engaged because they are already doing well. But when you track the same teams over time, a clear pattern emerges. When engagement improves, productivity tends to increase within the next one to three quarters. This means changes in engagement often lead to better productivity, not the other way around.
The table below shows the behavioral differences between engaged and disengaged teams, drawn from the same Gallup meta-analyses.
| Behavior | Engaged Team | Disengaged Team |
|---|---|---|
| Discretionary effort | Volunteers for stretch tasks | Does the minimum to avoid feedback |
| Focus during work hours | Sustained 60-to-90-minute deep-work blocks | Frequent context switching, short focus bursts |
| Annual retention | Significantly higher than the industry average | 18 to 43% higher turnover than engaged peers |
| Idea generation | Proactively raises improvements | Surfaces problems only when forced |
| Recovery after setbacks | Re-engages within days | Lingering disengagement for weeks |
For the foundational statistics on engagement and how it shapes broader business outcomes, see our companion guide on employee engagement statistics and impact on productivity. This blog focuses on the mechanism behind those numbers.
The Four Mechanisms That Convert Engagement into Productivity
Employee engagement doesn't translate into output automatically. It works through four specific channels. Each one produces a different kind of productivity gain, and each one breaks down in a different way. When you know which channel is underperforming on your team, you stop guessing and start fixing the right thing.
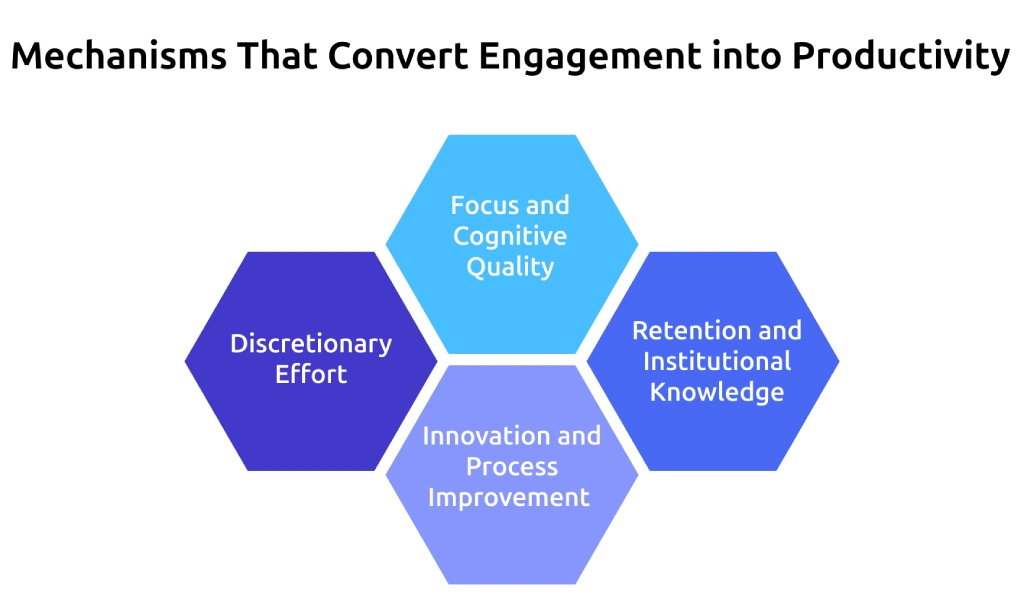
Mechanism 1: Discretionary Effort
Discretionary effort reflects the gap between what a role requires and what an engaged employee chooses to contribute. The role sets the baseline, but engagement determines how far above that level the team operates.
An engaged developer completes work ahead of schedule and improves related code without being asked. An engaged support representative picks up a late call instead of leaving it unresolved. These actions do not appear in job descriptions, but they consistently improve output across the team. Disengaged employees stay at the minimum required level, while engaged teams contribute more without external push.
How to Measure It
Track active time per shift, on-time delivery against estimated effort, and the percentage of tasks completed within the SLA buffer. At a team level, discretionary effort appears as consistent over-delivery without a rise in overtime. When active time remains stable, but delivery falls short of estimates, it clearly indicates that this mechanism is not working as expected.
Mechanism 2: Focus and Cognitive Quality
Engaged employees maintain deep work for longer periods and complete tasks with better clarity. Disengaged employees break attention more often, switch between tasks frequently, and produce lower-quality output even when total hours remain the same.
The difference comes from internal drive. When there is a strong connection to the outcome, focus stays steady without constant reminders. When that connection is missing, attention depends on deadlines and follow-ups, and it drops as soon as that pressure fades. According to the Microsoft Work Trend Index, employees face interruptions every two minutes during focus hours through meetings, emails, or notifications.
How to Measure It
Track uninterrupted focus blocks of 60 minutes or more, context-switching frequency based on app usage per hour, and rework rate. When rework increases without any change in logged hours, it clearly signals a drop in cognitive quality. You can track focus time and switching patterns automatically through a productivity tracking tool.
Mechanism 3: Retention and Institutional Knowledge
Engaged employees stay longer. As they spend more time in the team, their understanding of work, systems, and processes improves. This leads to higher productivity compared to new hires in the early stages. Someone with three years of experience understands the codebase, client history, internal workflows, and how to respond when issues arise. A new hire with similar skills still needs time to reach the same level of output.
This effect builds gradually but creates a long-term impact. According to SHRM, replacing an employee can cost between 50% and 200% of their annual salary, with lost productivity during the initial learning period as the biggest factor.
How to Measure It
Track 12-month retention rate by team, average tenure of high performers, and time to reach expected productivity for new hires. When top contributors leave faster than others, this mechanism starts to break, and the impact shows slower delivery and reduced output over time.
Mechanism 4: Innovation and Process Improvement
Engaged employees notice problems and speak up. Disengaged employees notice the same issues but continue working without addressing them. Over time, engaged teams refine how work flows, while disengaged teams continue with the same inefficiencies.
The key factor here is psychological safety. When there is a strong connection to outcomes, employees feel comfortable suggesting improvements. When that connection is missing, improving processes feels unnecessary, so issues stay unaddressed. As a result, engaged teams generate more ideas and implement them, while disengaged teams accumulate inefficiencies over time.
How to Measure It
Track the number of ideas raised per employee for each quarter, the percentage of ideas that get implemented, and improvements in process cycle time over time. If idea submissions drop after team changes or higher attrition, it signals a decline in engagement and psychological safety.
Disengaged teams cost more than you think.
Use Time Champ to spot the attrition signals early and keep your team's productivity on track.
Five Actions That Activate the Engagement-Productivity Loop
This section focuses on actions you can take to address gaps in engagement and productivity. Each action below connects directly to these gaps and outlines steps that help improve both engagement and productivity.
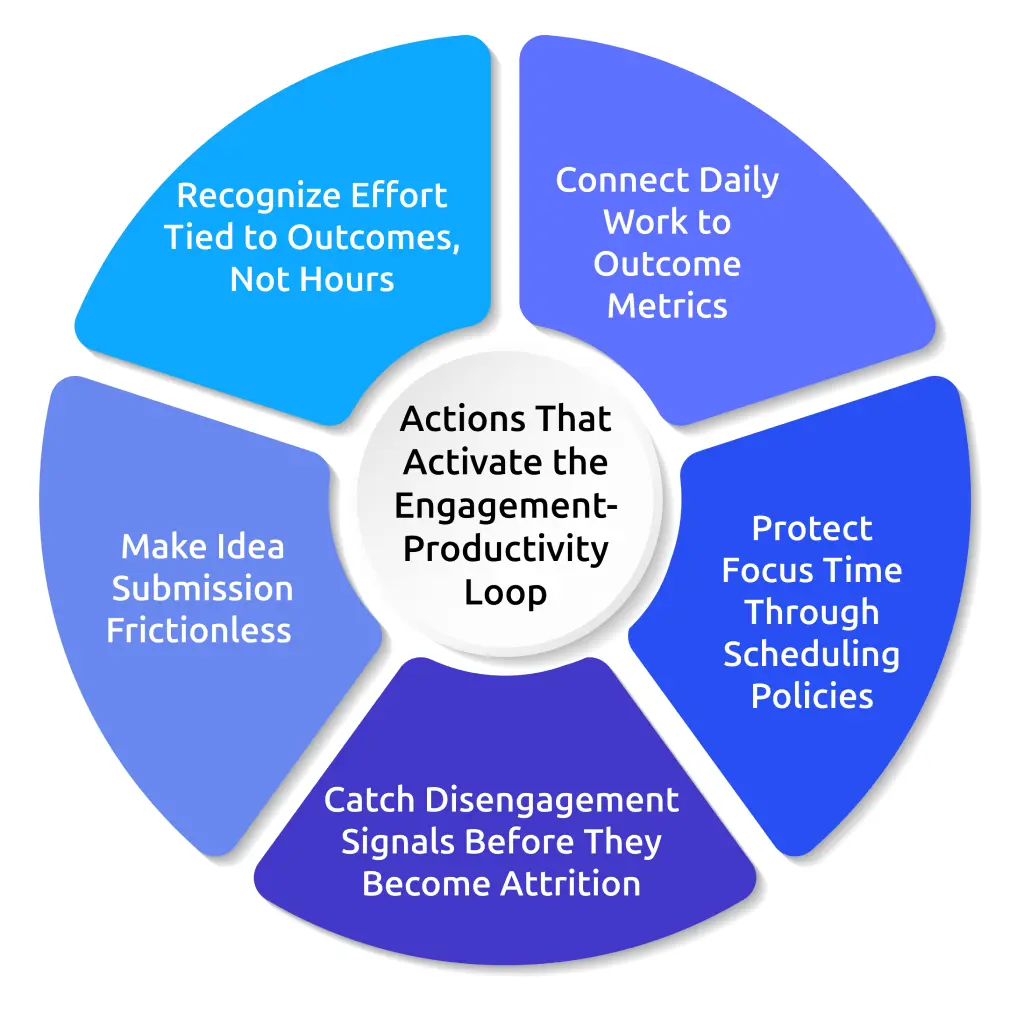
1. Connect Daily Work to Outcome Metrics
This action targets discretionary effort by showing the impact of work instead of only tracking activity. A support engineer who sees CSAT scores linked to tickets stays more involved than one who only tracks ticket counts. A developer who sees fewer user-reported bugs after a fix focuses more on quality instead of only tracking commits. Make these outcome metrics visible at the individual or small-team level, so work connects directly to results and effort increases naturally.
2. Protect Focus Time Through Scheduling Policies
This action targets focus and cognitive quality. Set shared focus blocks in team calendars, such as 9 to 11 AM and 2 to 4 PM, and turn off non-urgent notifications during those periods. Engaged employees use these blocks naturally, while others tend to switch between tasks unless a clear structure exists. This approach protects focus time across the team and removes the pressure to stay constantly available.
3. Catch Disengagement Signals Before They Become Attrition
This action targets employee retention. Engagement does not drop suddenly. It declines through clear signals such as lower active time, reduced participation in retros, late logins, fewer code review comments, and shorter focus blocks. Track these patterns regularly. When two or more of these changes appear for the same employee, plan a one-on-one conversation within the next seven days. A simple check-in helps address the issue early and prevents it from turning into a resignation.
4. Make Idea Submission Frictionless
This step improves innovation by making it easy to share ideas without delays. Idea flow drops when sharing feels slow or complicated. Use a single channel, a simple form, or a recurring retro question to capture suggestions quickly. Acknowledge every idea within five working days, even if it does not move forward. A quick response encourages more ideas, while no response leads to fewer suggestions over time.
5. Recognize Effort Tied to Outcomes, Not Hours
This step strengthens all four mechanisms. Recognition works as a multiplier when it highlights the right behavior. Praising long hours encourages burnout and low-value effort. Recognizing results achieved through clear focus and meaningful work strengthens engagement and drives better output. The way you communicate this matters. Highlight what the team delivered and how they achieved it, instead of pointing to extra hours spent.
When the Link Breaks Between Employee Engagement and Productivity - Three Failure Modes
Employee engagement and productivity do not always move together in a consistent way. At times, effort stays high, but results do not improve, and in other cases, output looks stable while engagement quietly drops. These gaps make it difficult to understand what is actually affecting performance. The following patterns explain where this connection starts to break and what to look at next.
Failure Mode 1: High Engagement, Low Productivity (The Misalignment Trap)
The team shows strong involvement, participation stays high, and attrition remains low. Yet employee productivity does not improve at the same pace. The issue is not a lack of effort. The effort goes into tasks that feel active but do not contribute to meaningful outcomes, so energy does not translate into results.
This happens when work loses alignment with business priorities over time. Engagement stays strong, but direction becomes unclear, so output remains flat. The fix is to realign goals instead of pushing for more effort. Connect team goals to business outcomes so work moves in the right direction. The OKR framework for employee productivity gives a clear starting point to bring focus back.
Failure Mode 2: High Productivity, Low Engagement (The Burnout Trap)
Output looks strong, and delivery stays on track, but engagement starts to drop quietly in the background. This phase often goes unnoticed because performance numbers still look stable. Over time, this creates pressure that builds without visible signs until it starts affecting retention and consistency.
This pattern becomes costly when it continues unchecked. Research from Meditopia shows that teams with sustained burnout see 18 to 20% lower productivity, and turnover intent doubles compared to engaged teams. Burned-out employees are also three times more likely to look for a new job, as highlighted by SHRM. When the workload stays above 90% utilization for long periods, it signals risk. Rebalance work early to prevent loss of experience and disruption in delivery.
Failure Mode 3: Surface Engagement, Real Disengagement (The Performance Theater Trap)
Engagement appears strong in surveys and meetings, but actual work patterns tell a different story. Active time stays low, focus blocks remain short, and idea contribution drops. This gap shows that responses do not always reflect real involvement in work.
This usually happens when honest feedback feels risky or when surveys do not lead to visible action. In such cases, responses stay positive while real engagement declines. Compare what teams say with how work actually progresses. When both do not align, trust the work patterns, because they show where engagement is actually falling.
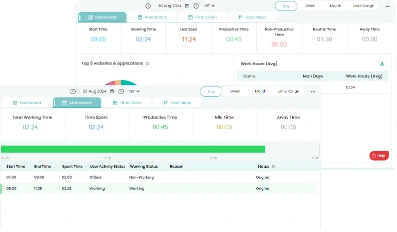
How Time Champ Helps You Act on Engagement and Productivity Signals?
Employee engagement and productivity often stay in separate tools, which makes it harder to see how they connect. Engagement data usually comes from surveys reviewed occasionally, while productivity data comes from tracking tools checked more frequently. This delay makes it difficult to notice changes early and take action at the right time.
Time Champ is an employee monitoring software with a workforce intelligence layer. It shows activity patterns such as active time, focus blocks, context switching, and attendance, along with engagement-related behavior in real time. When engagement drops, and activity patterns change at the same time, you can see it immediately and act early instead of fixing issues later. Time Champ's attrition risk module specifically tracks behavioral changes like declining active time, late logins, and reduced participation to help identify team members who may be losing engagement before it starts affecting retention.
Conclusion
Employee engagement and productivity improve when you clearly understand how work happens each day. Without that clarity, effort can stay high while results remain inconsistent. Small changes in focus, participation, and work patterns often signal issues early, and acting on them at the right time helps maintain steady progress and better outcomes.
Improving productivity starts with seeing what’s really happening at work.
Use Time Champ to gain workforce visibility and make timely, confident decisions.

Thasleem Shaik
Table of Content
 What the Research Actually Says About Employee Engagement and Productivity?
- The Four Mechanisms That Convert Engagement into Productivity
- Five Actions That Activate the Engagement-Productivity Loop
- When the Link Breaks Between Employee Engagement and Productivity - Three Failure Modes
- How Time Champ Helps You Act on Engagement and Productivity Signals?
- Conclusion
Related Blogs
Find the best employee engagement software for 2026. Compare features, pricing, pros & cons to improve culture, retention, and team productivity ROI.
Thasleem Shaik | Apr 02, 2026
Revitalize remote teams with engaging and fun activities for employee engagement, fostering stronger bonds and enhancing employee productivity.
Shabana Shaik | Mar 20, 2024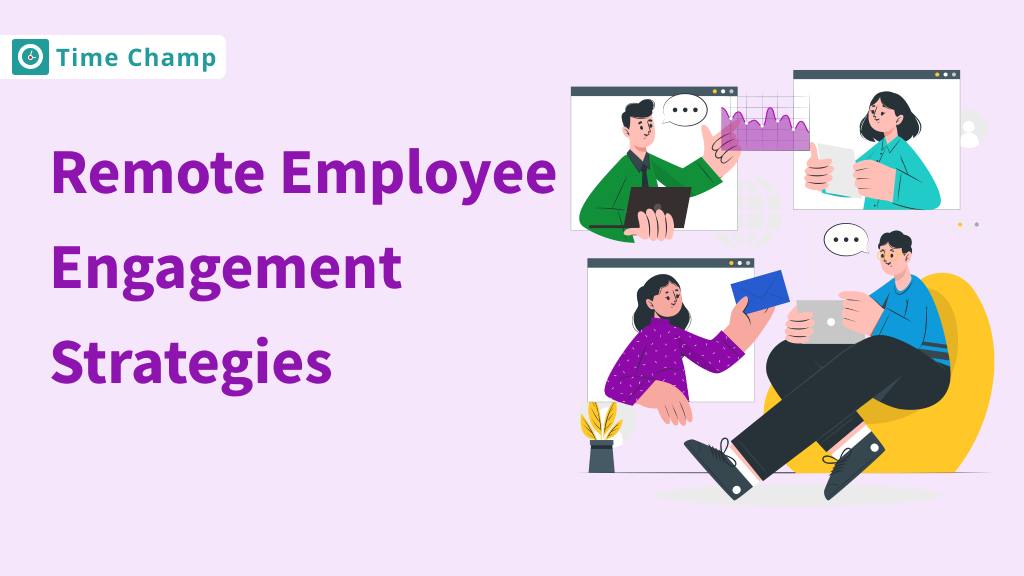
Explore our top 9 strategies to enhance remote employee engagement, tackle common challenges, and keep your team motivated and connected.
Shabana Shaik | Oct 25, 2024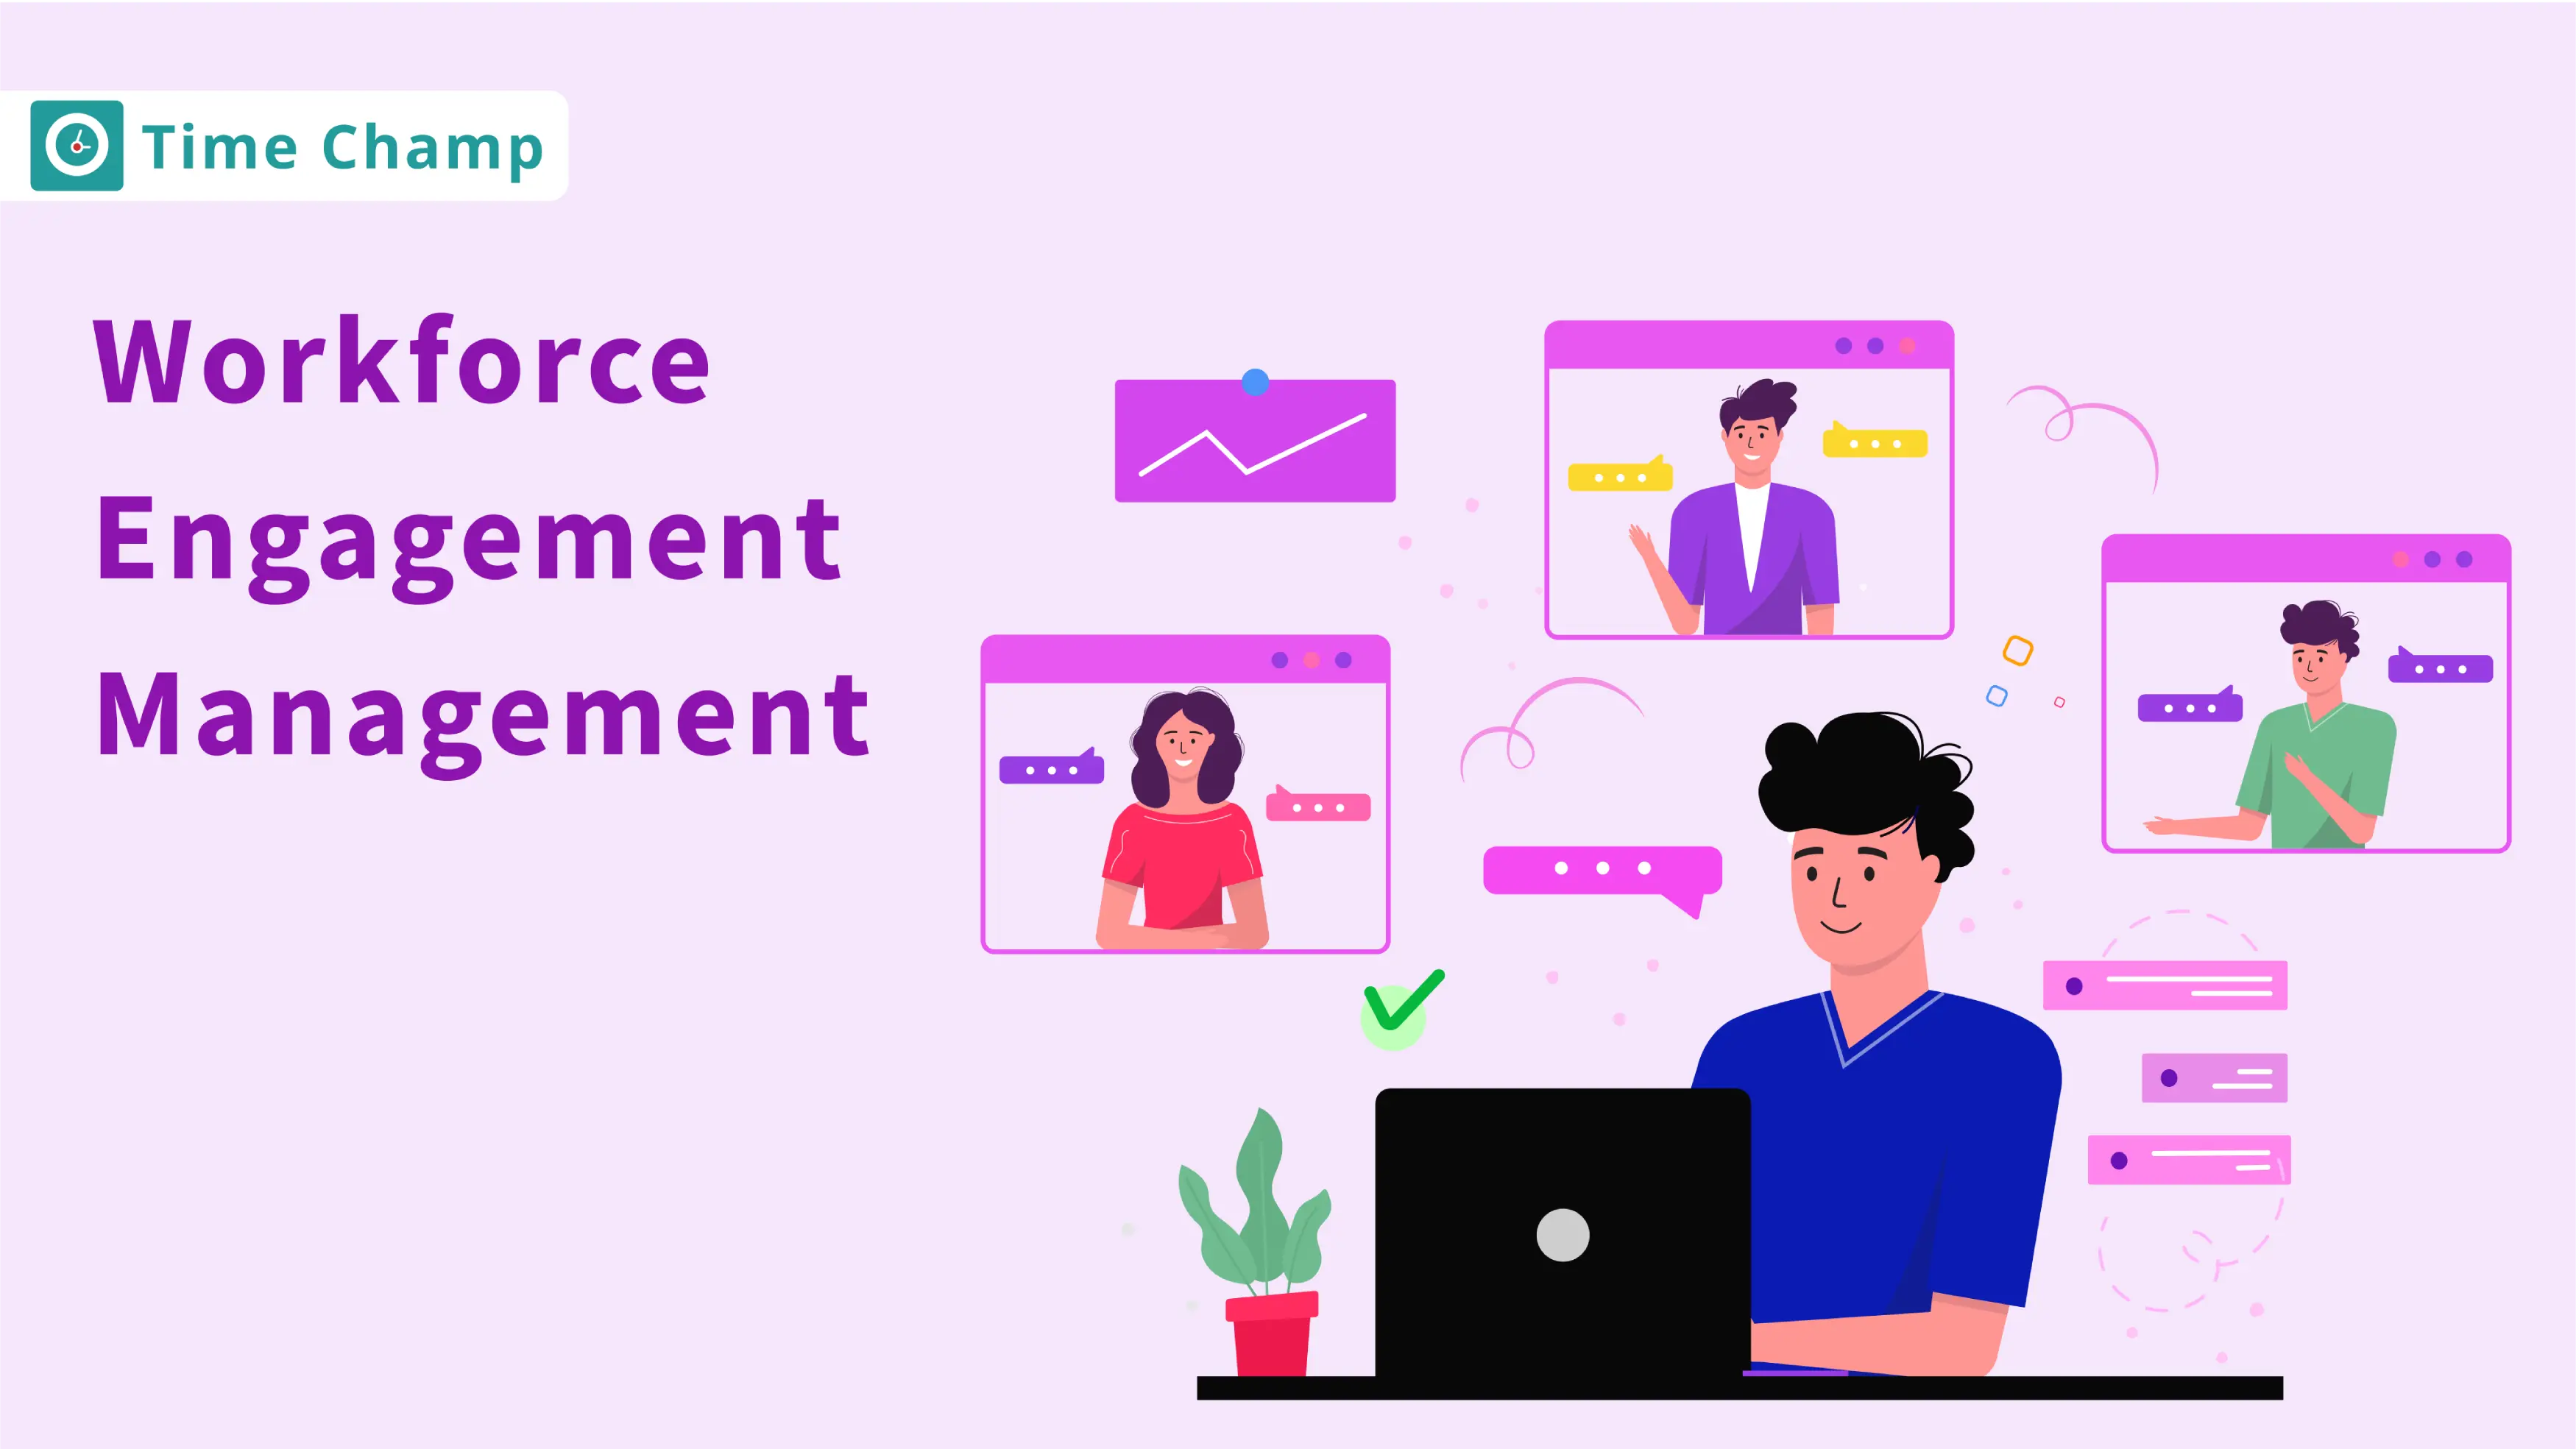
Learn what workforce engagement management (wem) is, why it matters in contact centers, components, benefits, and how to choose the right software.
Shabana Shaik | October 01, 2025
Learn how to analyze productivity data, identify patterns, avoid common mistakes, and build reports that turn insights into clear, actionable decisions.
Thasleem Shaik | May 01, 2026Address employee concerns about productivity tracking with clear communication, rollout steps, and practical scripts that build trust and transparency.
Thasleem Shaik | May 01, 2026Ready to Manage Your Workforce Smarter?
Join our family of 1500+ companies using smart insights to redefine workforces!
Free Trial
No Credit Card Required