CSAT vs. NPS vs. CES: How They Differ and When to Use Each
CSAT vs. NPS vs. CES compared side by side, covering what each metric measures, how to calculate scores, when to use them, and their key limitations.
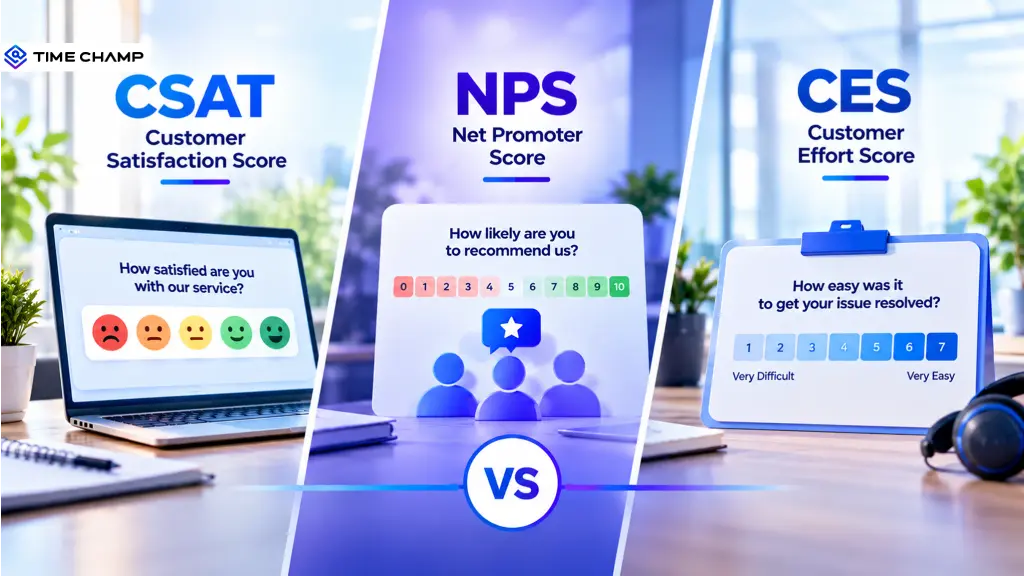
You have a customer who just rated a support interaction highly. That sounds like a win. But would that same customer recommend your brand? And did they actually find the process easy?
These questions can lead to very different answers because customer experience has more than one dimension. CSAT vs. NPS vs. CES is not about choosing the best score. It is about choosing the right question for the experience you want to measure.
In this blog, we’ll break down how CSAT, NPS, and CES work, where each metric fits, and when you should use one, two, or all three to get a clearer view of your customer experience.
What Is CSAT (Customer Satisfaction Score)?
CSAT (Customer Satisfaction Score) shows how satisfied your customers are with a specific product, service, or interaction. You usually measure it immediately after an experience, such as a support conversation, purchase, onboarding step, or service interaction. That timing helps you capture your reaction while the experience is still fresh.
CSAT works best when you want to answer a focused question, such as whether a recent interaction met your expectations. Unlike broader relationship metrics, it gives you a closer look at individual moments across the customer journey.
How to Calculate CSAT
You calculate CSAT by dividing the number of positive responses by the total number of responses, then multiplying the result by 100.
CSAT = (Number of satisfied responses ÷ Total responses) × 100
For example, suppose 100 customers respond to your survey, and 80 choose1-to-isfied or very satisfied rating. Your CSAT would be 80%. On a common 1 to 5 scale, ratings of 4 and 5 typically count as positive responses.
Your survey can use different rating scales, including 1 to 5, 1 to 7, or 1 to 10. Because the scoring method can change with the scale, keep your methodology consistent when you compare results over time.
What Is a Good CSAT Score?
A CSAT score between 75% and 85% is generally considered strong across most industries. A score of 80% or higher means at least four out of five customers gave a positive rating. However, the right benchmark can vary by industry. B2B SaaS companies typically score between 78% and 85%, while industries such as telecom and insurance often see lower scores because of their complexity and limited customer choice.
Instead of focusing only on a fixed target, track how your score changes over time. For example, if your CSAT stays around 80% but drops to 74% after you change a process, that shift can tell you more than a general industry benchmark.
When to Use CSAT
Use CSAT when you need to measure satisfaction at a specific point in the customer journey.
- After a support interaction to check how satisfied you are with the help you received.
- After a purchase to measure satisfaction with the buying experience.
- After onboarding to see whether the onboarding experience met expectations.
- After a delivery to capture feedback on the delivery experience.
Missing the operational details behind changing CX scores?
Use Time Champ’s productivity reports to turn team activity into useful insights.
What Is NPS (Net Promoter Score)?
Net Promoter Score (NPS) tells you how loyal your customers are and how likely they are to recommend your business to someone else. Bain & Company partner Fred Reichheld introduced it in a 2003 Harvard Business Review article, and it has since become one of the most widely tracked customer loyalty metrics.
You collect NPS with a single question: "On a scale of 0 to 10, how likely are you to recommend us to a friend or colleague?" Based on the score, you sort every respondent into one of three groups.
- Promoters (9 to 10): Your most loyal customers. They keep buying and refer others.
- Passives (7 to 8): Satisfied but unenthusiastic. A competitor can win them over easily.
- Detractors (0 to 6): Unhappy customers who can damage your reputation through negative word of mouth.
Unlike CSAT, which measures how someone felt about one interaction, NPS measures how they feel about your entire relationship with them. This is the core of the net promoter score vs. customer satisfaction distinction: one looks backward at a single touchpoint, the other looks forward at long-term loyalty.
How to Calculate NPS
You calculate NPS by subtracting the percentage of Detractors from the percentage of Promoters.
NPS = % Promoters − % Detractors
Passives don't get left out of your response count, but you exclude them from the formula itself.
Here's a worked example. Say 100 people respond to your survey. 60 give you a 9 or 10 (Promoters), 20 give you a 7 or 8 (Passives), and 20 give you a 0 to 6 (Detractors).
60% Promoters − 20% Detractors = NPS of 40
Your result always lands somewhere between -100 (every respondent is a Detractor) and +100 (every respondent is a Promoter).
What Is a Good NPS Score?
You can read your NPS on a simple scale.
- Above 0: You have more Promoters than Detractors. This gives you a positive baseline.
- Above 30: This is generally considered a good score and shows that you are competitive across most sectors.
- Above 50: This indicates an excellent score and reflects strong customer loyalty.
- Above 70: This falls into the world-class range, and very few companies maintain this level consistently.
However, you should not treat these numbers as fixed targets. Your industry can change what a good NPS looks like. Software and telecom companies often average in the 30s and 40s, while insurance and professional services can regularly reach 60 or higher.
Compare your score with relevant industry benchmarks and track how it changes over time. This gives you a more accurate view of your performance than relying on a single generic target.
When to Use NPS
Use NPS when you want to measure the overall strength of your customer relationship rather than satisfaction with one interaction.
- To measure customer loyalty over time.
- To track willingness to recommend your brand, product, or service.
- To monitor relationship health across different periods.
- To compare loyalty trends across customer segments.
- To identify changes in customer advocacy after major business or product changes.
- To support retention and referral analysis alongside behavioral and customer data.
NPS works best as a periodic relationship measure rather than a survey after every individual interaction. Its broader focus makes it useful when you want to see whether your overall customer relationship is getting stronger or weaker.
What Is CES (Customer Effort Score)?
CES (Customer Effort Score) measures how easy or difficult it was for you to complete a specific task or resolve an issue. Instead of asking whether you were satisfied overall, CES focuses on the effort involved in an interaction.
You can use it after a support interaction, purchase, checkout, onboarding process, or self-service experience to see where friction may be slowing you down. A common CES question asks you to rate how strongly you agree that the company made it easy to handle your issue.
How to Calculate CES
CES usually uses a 1 to 5 or 1 to 7 rating scale. You calculate the score by adding all responses and dividing the total by the number of responses.
CES = Total of all ratings ÷ Number of responses
For example, if five responses total 25 points, your CES would be 5.
25 ÷ 5 = 5 CES
Check the direction of your scale before interpreting the result. Some surveys treat a higher score as easier, while others treat a lower score as easier. Keep the same scale and question wording when tracking results over time.
What Is a Good CES Score?
On a 1-to-7 scale where a higher score means an easier experience, a CES of 5 or higher is generally considered good. A score of 6 or higher indicates a stronger result, while a score below 4 can point to significant friction.
Your benchmark can change depending on the scale and question you use. Rather than treating one number as a universal target, compare results from the same type of interaction and watch how your score changes over time.
When to Use CES
Use CES when you want to measure how easy it was to complete a specific task.
- Immediately after a support interaction, to assess how easy it was to receive help.
- After using self-service resources, such as a knowledge base or chatbot, to evaluate how easily you found a solution.
- After completing a complex process, such as onboarding or setting up an account, to measure how simple the process was to complete.
Did You Know: According to Service Innovation Labs, 96% of customers who have a high-effort experience become more disloyal to the brand, compared with only 9% of customers who have a low-effort experience. This shows that reducing customer effort can help improve loyalty and encourage repeat purchases.
CSAT vs. NPS vs. CES: Key Differences Explained
The three metrics answer different questions, so the right choice depends on what you want to measure. Here is a clear side-by-side view.
| Comparison point | CSAT | NPS | CES |
|---|---|---|---|
| Full Name | Customer Satisfaction Score | Net Promoter Score | Customer Effort Score |
| What It Measures | Satisfaction with a specific interaction, product, or service | Overall loyalty and willingness to recommend | Effort required to complete a task or resolve an issue |
| Main Question | How satisfied were you with your experience? | How likely are you to recommend us? | How easy was it to resolve your issue or complete the task? |
| Typical Scale | 1 to 5 or 1 to 10 | 0 to 10 | 1 to 5 or 1 to 7 |
| How You Calculate It | Positive responses ÷ total responses × 100 | % Promoters − % Detractors | Average of all effort ratings |
| Score Range | 0% to 100% | -100 to +100 | Depends on the survey scale |
| Best Timing | Immediately after a specific interaction | At regular intervals | Immediately after a specific task or interaction |
| Best For | Measuring satisfaction with individual touchpoints | Tracking loyalty and the overall customer relationship | Identifying friction in customer journeys |
| What The Score Helps You Spot | Weak or successful interactions | Changes in loyalty and advocacy | Processes that feel difficult or time-consuming |
| Main Strength | Simple and easy to connect to a specific experience | Gives you a broad view of customer loyalty | Helps you identify unnecessary customer effort |
| Main Limitation | Focuses on one experience at a time | Does not explain the reason behind the score on its own | Focuses mainly on effort within a specific experience |
The biggest difference comes down to what you want to know. CSAT focuses on satisfaction, NPS looks at loyalty, and CES focuses on effort. You can use each metric at a different stage of the customer journey to get a more complete view of the experience.
CSAT vs. NPS vs. CES: Benefits and Limitations
Each metric gives you a useful signal, but none tells you the full customer story on its own. The right choice depends on the question you want to answer and the type of experience you want to evaluate.
The table below summarizes the key metrics and explains when each one is most useful.
| Metric | Benefits | Limitations |
|---|---|---|
| CSAT | Easy to measure and simple to interpret. It helps you pinpoint satisfaction with a specific interaction, such as a support call, purchase, or onboarding experience. | It captures a single moment rather than the broader customer relationship. Responses can also vary based on expectations and the situation surrounding the interaction. |
| NPS | Gives you a simple score for tracking customer loyalty over time. It can also indicate how willing you are to recommend the brand and help you monitor changes in overall customer sentiment. | The score alone does not tell you why someone gave a particular rating. You often need follow-up questions or other feedback to identify the cause behind the result. |
| CES | Shows how much effort a customer needs to complete a task or resolve an issue. It can help you identify friction in support, onboarding, checkout, and self-service journeys. | It focuses on a specific task, so it does not show overall satisfaction or loyalty. The score can also vary depending on the question and rating scale you choose. |
How to Use CSAT, NPS, and CES Together
CSAT, NPS, and CES become more useful when you connect them instead of looking at each score in isolation. Each metric gives you a different signal, so you can use them at different stages to see what is working and where the customer experience needs attention.
A practical approach is to match each metric with the type of feedback you need.
- Use CES after a support interaction to see how much effort it took to resolve an issue.
- Use CSAT after an important interaction to check whether the experience met expectations.
- Use NPS at regular intervals to track the strength of the overall customer relationship.
Put The Metrics into Practice
Suppose you want to improve your support experience. Start by checking CES after support interactions. A low score can point to unnecessary steps, delays, or difficulty during the resolution process.
Next, look at CSAT to see how customers felt about the outcome. A high CSAT score can show that the solution met expectations, even if the process required more effort than it should.
Then, track NPS periodically to see whether improvements at the interaction level contribute to stronger loyalty over time.
Look At the Scores Together
The three metrics can also reveal patterns that a single score may miss. For example, strong CSAT with weak CES can mean that customers appreciate the final solution but still find the process difficult. That gives you a clear reason to focus on reducing friction rather than changing the outcome.
NPS adds another layer by showing whether the overall customer relationship is strengthening or weakening. When you review all three together, you can connect individual experiences with broader customer sentiment.
The goal is not to send more surveys or collect more numbers. Choose the right metric for each stage, keep your measurement consistent, and use the results to decide where your customer experience needs improvement.
Do you need clearer data before acting on a performance issue?
Use Time Champ reports to turn everyday work activity into actionable visibility.
Conclusion
CSAT, NPS, and CES each answer a different question, so the right metric depends on what you want to measure. CSAT helps you evaluate specific experiences, CES points to friction, and NPS gives you a broader view of loyalty. Using them together can help you connect individual interactions with the overall customer relationship. If you want to improve the operational factors behind these experiences, Time Champ can give you visibility into productivity, time, activity, and workload across your team.

Thasleem Shaik

Table of Content
 What Is CSAT (Customer Satisfaction Score)?
- What Is NPS (Net Promoter Score)?
- What Is CES (Customer Effort Score)?
- CSAT vs. NPS vs. CES: Key Differences Explained
- CSAT vs. NPS vs. CES: Benefits and Limitations
- How to Use CSAT, NPS, and CES Together
- Conclusion
Related Blogs
Learn simple ways to measure and boost call center productivity, helping your team work more efficiently and improve customer service.
Jahnavi Pulluri | Jan 10, 2025
How to start a call center using a complete setup process covering costs, software, staffing, compliance, operations, and business planning.
Thasleem Shaik | Jul 29, 2026
Discover the 10 best call centre quality assurance software for 2025. Compare features, pricing, pros, and cons to boost service quality and performance.
Thasleem Shaik | Nov 07, 2025
Discover the ultimate guide to call centre workforce management. Learn key functions, pros, cons, optimisation tips, and how real-time WFM boosts ROI.
Thasleem Shaik | Oct 01, 2025
The Candidate Call Back Rate indicates the number of candidates who are contacted for the next steps of the job application process.
Vijaya Lakshmi | Apr 02, 2024
Discover the 18 global best call center outsourcing companies to optimize customer support. Choose from leading names for exceptional service and efficiency.
Mounika Sai | Nov 16, 2023


 4.7/5 avg.
Ready to Manage Your Workforce Smarter?
Join our family of 1500+ companies using smart insights to redefine workforces!

Free Trial
No Credit Card Required