Home / P / Productivity Analysis
Productivity analysis is a key action that can be used to evaluate the efficiency of an organization’s processes and its employees in contributing to the organization’s performance. Organizations know that the various business units are part of unique workflows, responsibilities or dependencies. By evaluating their differences, organizations can effectively measure, benchmark, and improve productivity levels. Engaging in productivity analysis over various indices, from simple ratios to sophisticated indices, gives an organization a structured method to identify and resolve bottlenecks.
The analytical frame supports decisions and continuous improvement. For example, in the second quarter of 2025, the nonfarm business sector's labor productivity increased by 2.4% after labor productivity fell by 1.8% in the prior quarter, as output increased by 3.7% but hours worked increased by just 1.3%. Focusing on productivity analysis helps the organization bring processes together, improve efficiency and enable continuous improvement. It changes the value of productivity from a measurement and evaluative use to a strategy to manage performance, efficiency, and long-term development.
What is a Productivity Analysis?
Productivity analysis is the methodical investigation of the extent to which resources, in particular human resources, are utilized effectively to produce outputs. It involves measuring inputs against outputs in order to discover areas of deficiency, improve workflows, or increase overall efficiency toward the achievement of organizational goals.
Productivity analysis is critical for understanding how work processes operate and where adjustments can be made. It includes measurable quantitative metrics, such as output per hour or errors per interaction, as well as qualitative metrics, such as employee feedback. Employee productivity analysis enables organizations to identify performance deficiencies, improve the efficiency of the utilization of resources, and improve alignment with work objectives.
The importance of productivity analysis primarily lies in its ability to create a complete overview of how efficiency is intertwined. It tracks performance to identify bottlenecks, evaluates trends, and ensures that employees are contributing their efforts towards business growth. Organizations can develop intelligent business strategies that enhance and extend competitive advantage through data-driven metrics and human insight. This helps them compete and adapt to changes in the economy, society, and business.
What Are the Types of Productivity Analysis?
There are different ways of carrying out productivity analysis, and each one emphasizes a particular dimension of workforce productivity. Here are five specific types of productivity analysis that will give organizations a clearer understanding of productivity.
1. Employee Efficiency Score
This metric calculates employee output on average per employee in relation to the timeframe. It helps leaders ascertain current employee capacity to engage new employees if warranted.
2. Attendance Impact Ratio
The attendance rate directly correlates to productivity, and this is the percentage of employee absences. High levels of absenteeism may indicate stress, sickness, or disengagement from the workplace.
3. Employee Turnover Rate
This metric tracks how often employees leave the organization. Turnover rates that are high indicate possible issues with organizational culture, opportunities for career growth, or poor management policies.
4. Task Completion Effectiveness Rate
The task completion effectiveness rate compares the number of assigned tasks to the number of completed tasks. This metric indicates how simple employees are capable of staying on top of their workload. It is helpful in spotting teams that are succeeding in delivery versus teams that may need extra support.
5. HR Expenses Per Employee
This metric tracks the overall amount spent on employee-related costs for HR per employee. Including: salary, benefits, etc. The right costs of HR spending with flat metrics for results raise red flags for effective use of human capital.
What Are the Examples of Productivity Analysis?
Analyzing productivity is most effective when used in actual working environments. It provides organizations with information regarding efficiency, the ability to analyze return on investment, and systems that a company can use to sustain success.
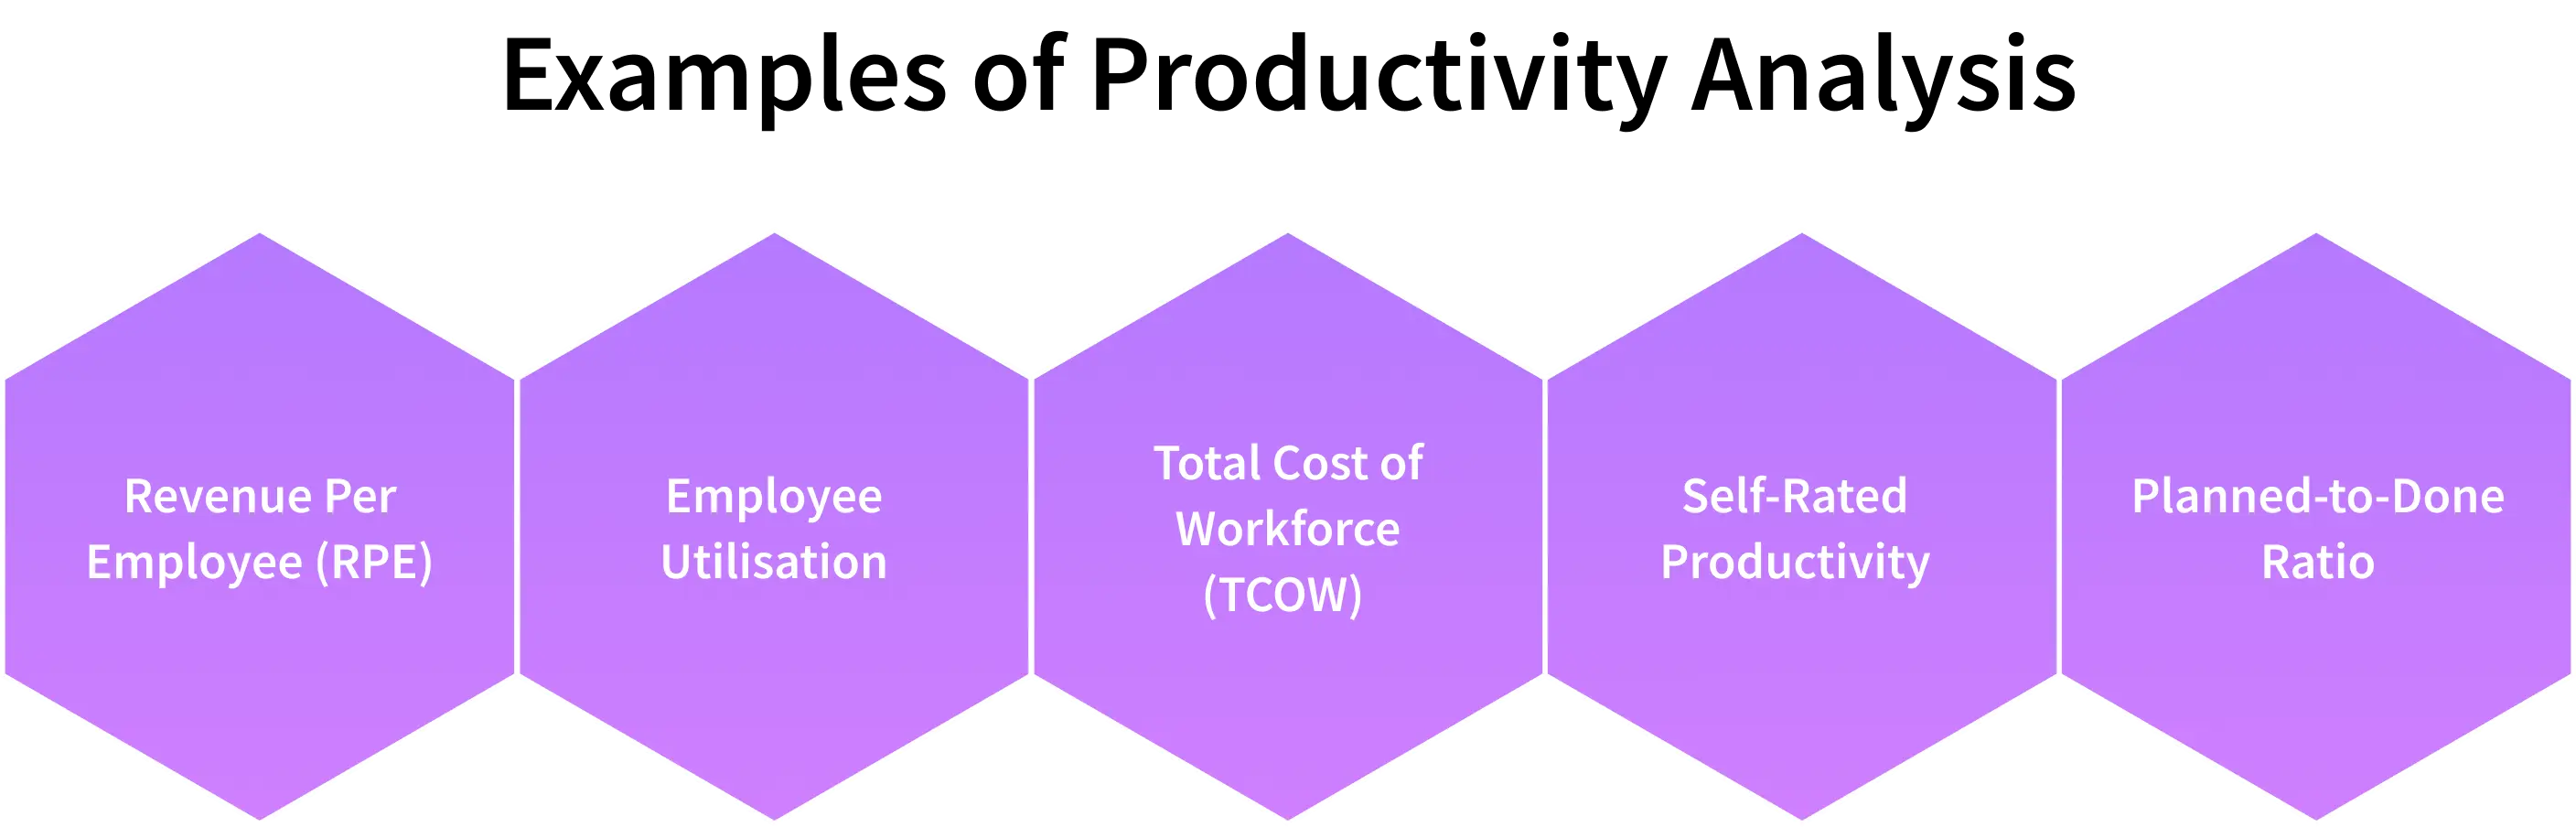
1. Revenue Per Employee (RPE)
Illustration: A marketing agency has an annual revenue of ₹8 crore and a workforce of 80 employees.
Calculating RPE, we take ₹8 crore ÷ 80 = ₹10 lakh per employee.
Thus, we can conclude that each employee, on average, brings in ₹10 lakh of revenue for the company. As RPE increases, we can safely assume the workforce has become more efficient and increased profitability.
2. Employee Utilization
Illustration: An IT consultant has 160 working hours in a month, and of those, 100 are billable client work.
Utilization Rate = 100 ÷ 160 = 62.5%.
It demonstrates utilization for any work activities in open, billable client time, meaning that 62.5% of that individual's time earns the company revenue. This helps managers make decisions on whether it is appropriate to increase billable work or decrease non-billable work .
3. Total Cost of Workforce (TCOW)
Illustration: A mid-sized startup spends ₹20 crore on salary, ₹2 crore on hiring and recruitment, and ₹1 crore on training and human resource operations annually.
TCOW = 20 + 2 + 1 = ₹23 crore.
Tracking TCOW against annual company revenue helps the company assess whether it is spending its workforce money effectively on maximum productivity and increased profit.
4. Self-Rated Productivity
Illustration: During one of the monthly reviews, an employee rated their productivity at 8/10, delivering 30 productive hours of work, but also reported being interrupted frequently with meetings.
With this kind of feedback, managers can work with the employee or team to determine when meetings are not necessary or re-prioritize the workload so an employee can realize their true potential.
5. Planned-to-Done Ratio:
Illustration: A content writer is given 25 articles in a quarter and completes 20 of them.
Planned to Done ratio = 20 ÷ 25 = 80%.
A consistently high ratio indicates a worker is completing tasks, while a low ratio could indicate a poorly set deadline or resource depletion.
How to Implement a Productivity Analysis?
In order for productivity analysis to provide concrete findings, organizations require a structured yet adaptive model. Listed below are the key steps to ensure implementation is effective.
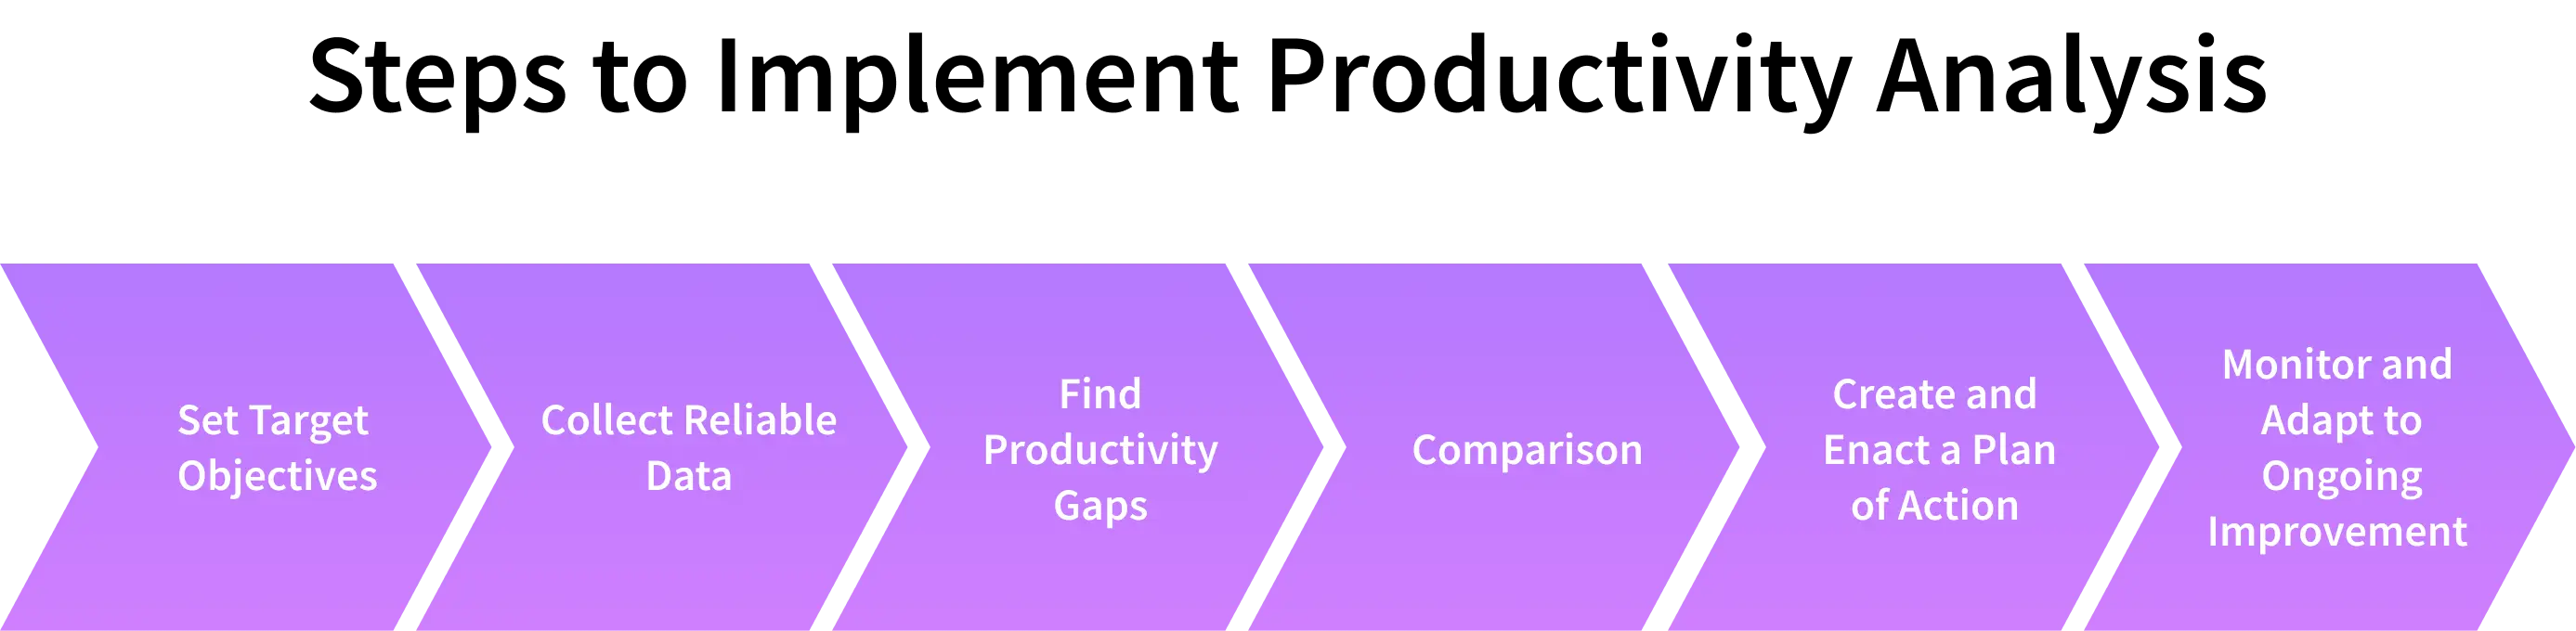
1. Set Target Objectives
Begin with precisely what you want to accomplish: reducing costs, improving efficiency , or improving employee engagement. Clearly defined goals are the foundation of your analysis.
2. Collect Reliable Data
Utilizing technology, draw real-time information concerning performance, workflows, and staff productivity. Quality in data will help ensure that your analysis results in changes you can implement.
3. Find Productivity Gaps
Keep an eye out for delays, redundant tasks, or areas where groups feel frustrated. Knowing what you know, apply the gaps you have found in order to determine priorities and where action might be necessary.
4. Performance Evaluation and Comparison
Assess productivity by examining current performance versus past results or industry benchmarks. The insights results support superior decisions and can help execute activities that increase efficiency and growth.
5. Create and Enact a Plan of Action
Construct a practical roadmap divided into sequential foundation steps from automating processes to enabling improved workflows. Take one step at a time to carefully implement each stage, ensuring smooth adoption and measurable progress at every level.
6. Monitor and Adapt to Ongoing Improvement
Frequently assess productivity, using transparent and explicit measures so that you can observe the way processes and employees are working. Make adjustments to operations as informed by the data and improve bottlenecks or inefficiencies in the processes.
What Are the Benefits of Productivity Analysis?
Performing a productivity analysis gives organizations important information on how well resources are being leveraged. It helps optimize operations, enhance workforce productivity, and create a benchmark for sustainable growth. These are the major reasons why.
1. Improves Time Management
By finding wasteful delays and workflow bottlenecks, productivity analysis enables individuals and teams to concentrate on high-level results. It reduces wasted effort and ensures resources are used efficiently, ultimately optimizing overall output.
2. Better Goal Alignment
The accuracy of data measurement enables companies to establish quantifiable and achievable goals in line with overall company goals. It also helps determine accountability within the organization, which ultimately drives workers.
3. Data-driven Decision Making
When a leader has accurate performance data, they can make informed and strategic decisions about the best use of time and processes for improvement. They can also identify key areas to focus on in the future.
4. Streamlines Operational Efficiency
Product analysis identifies inefficiencies in the work processes within and between departments. This helps organizations streamline processes and reduce turnover times.
5. Short vs Long-Term Need Considerations
Organizations must weigh an urgent response against a future consideration in the longer term. A good strategy map can be useful to weigh the everyday 'need' of work accomplishment alongside building sustainable results.
What are the Challenges of Productivity Analysis?
Although productivity measures are a powerful way to enhance performance, organizations can encounter challenges that impede organizational performance. Here are the challenges:
1. Challenges with Data Collection
One of the initial challenges managers will encounter is gathering actual data. When employees are afraid of monitoring their work, procuring correct data is difficult. By promoting a transparent culture and using automated software like Time Champ , where employees do not need to monitor their work manually, organizations might have to depend on more accurate data.
2. Constrain with Data Interpretation
Complete sets of data, if interpreted improperly, can yield unwanted results if there are discrepancies, data missing or flawed analysis. Using more advanced analytics and credible sources can help provide an analysis of significant results from productivity measures.
3. Employee Resistance to Change
Almost every organizational change will find some degree of resistance from affected employees. Positive communication, involving employees as part of the change process, and showing that change will lead to a positive result, gives support for future changes.
4. Limited Time and Resources
Although carrying out a productivity assessment has the capacity to yield positive results, it demands considerable time investment and perhaps finance. Offering proper time investment and employing different types of technology will advantage contractors and incorporate all options in the analysis.
5. Enhances Employee Performance
Organizations must weigh an urgent response against a future consideration in the longer term. A good strategy map can be useful to weigh the everyday 'need' of work accomplishment alongside building sustainable results.
What Should Be Included in the Productivity Analysis Template?
A template for productivity analysis serves as a guide to assessing performance. It consolidates data, outlines strengths and weaknesses, and aids companies in developing strategic plans for generating growth.
1. Identified Purpose and Targets
Every template is to begin with an explanation for conducting the analysis, providing context and meaning for the evaluation. It should also include clearly stated measurable targets that provide a guide and parameters for tracking progress and monitoring if objectives are being met in a satisfactory manner.
2. Productive Metrics
There should be a comprehensive list of productive metrics , including KPIs (such as output per unit, sales per employee, or efficiency ratios), in order to assess overall productivity.
3. Trustworthy Data Sources
The tools, systems, or manual logs that provide information for the investigation should be noted to maintain trustworthiness and robustness in regard to the analysis.
4. Comparative Performance Benchmarks
Templates should contain sections to compare the existing metrics to historical data. This helps organizations see trends, note improvements or declines, and observe how their performance measures over a period of time.
5. Growth Strategy Roadmap
Summarize the analysis with a robust plan, clearly outlining recommendations, timelines, and next steps. Each aspect should specifically relate to productivity improvements and how proposed activities will improve efficiency and performance.